by Don Vialoux, TechTalk
Upcoming US Events for Today:
• Durable Goods Orders for December will be released at 8:30am. The market expects an increase of 1.6% versus an increase of 0.7% previous. Excluding Transportation, the increase is expected to be 0.4% versus an increased of 1.6% previous.
• Pending Home Sales for December will be released at 10:00am. The market expects a decline of 0.3% versus an increase of 1.7% previous.
• Dallas Fed Manufacturing Survey for January will be released at 10:30am. The market expects 4.0 versus 6.8 previous.
Upcoming International Events for Today:
• New Zealand Trade Balance for December will be released at 4:45am EST. The market expects –105M versus –700M previous.
The Markets
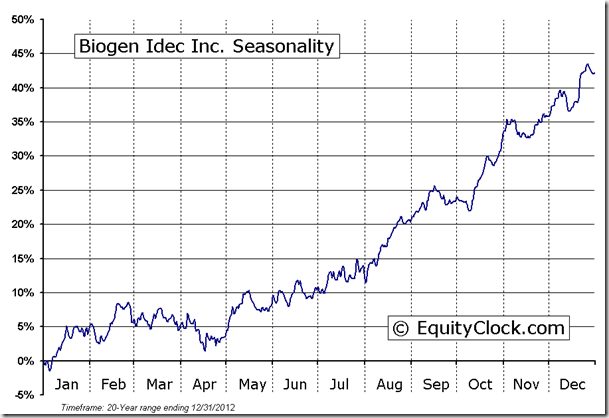
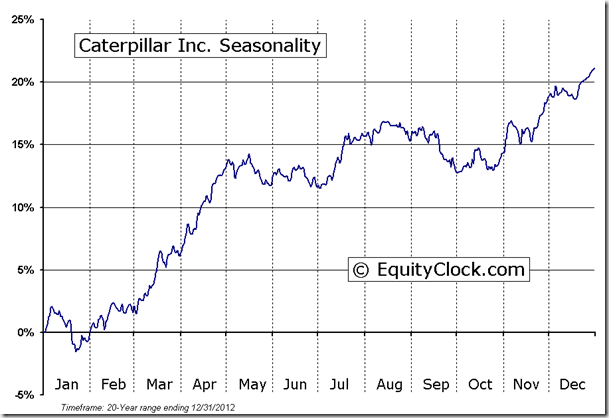
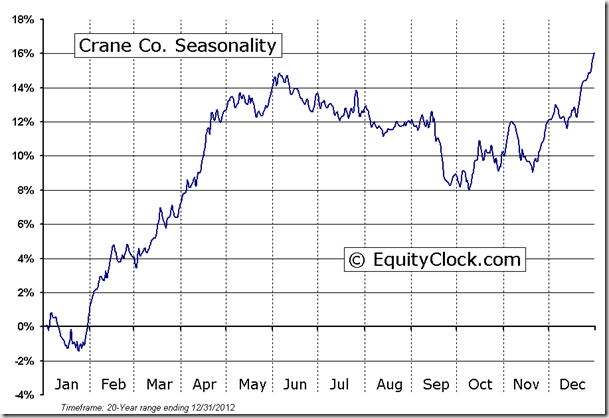
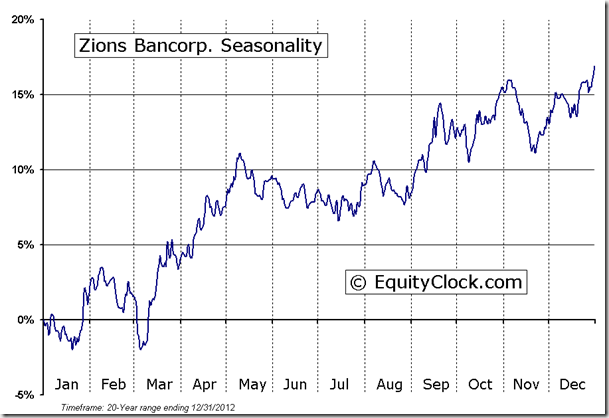
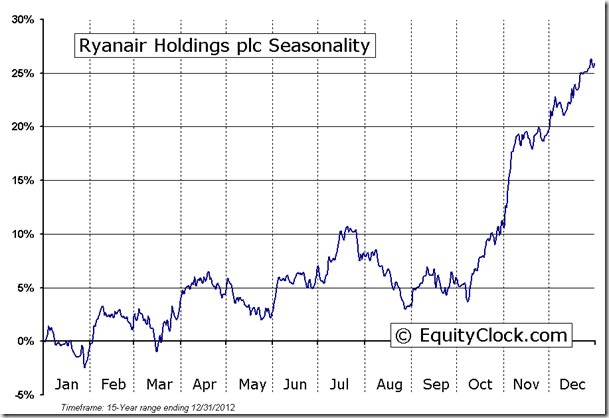
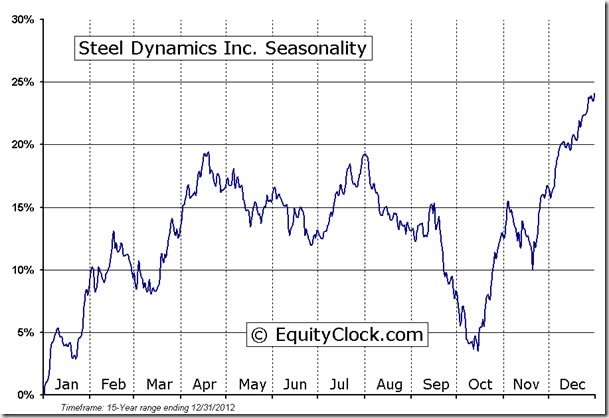
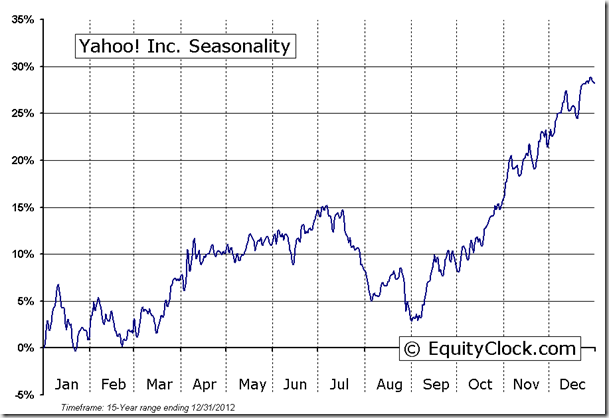
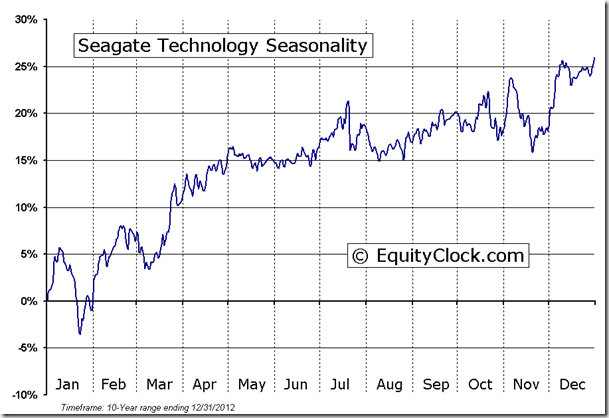
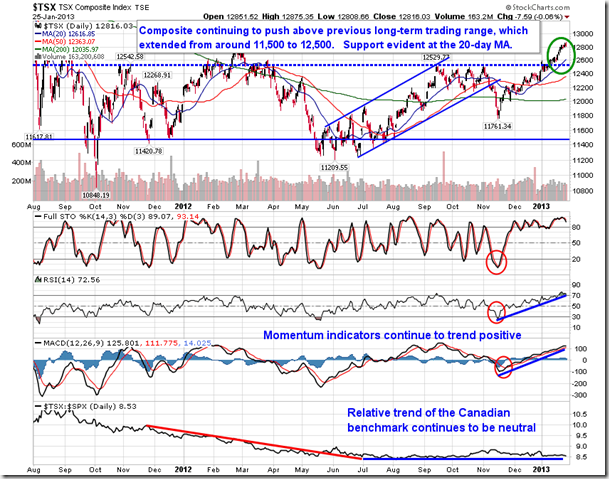
Markets ended higher on Friday, boosted by positive earnings results from Procter & Gamble, Microsoft, AT&T, Halliburton, and Starbucks. According to Factset, “of the 134 companies that have reported earnings to date for the fourth quarter, 69% have reported earnings above estimates,” which is in-line with the recent average beat rate. Technology and Materials have shown the largest percent of earnings beats thus far. For the week ahead, 380 companies are expected to report, just less than a third (104) of which are S&P 500 companies. Earnings season peaks during the week following with 439 companies issuing their quarterly results. Reaction to earnings reports has been very positive, pushing equity benchmarks to the highest levels in over 5 year, some of which have even charted new all-time highs. It remains questionable as to whether the rally can sustain itself with such little volatility once earnings season winds down at the end of the next two weeks. Companies reporting on Monday include Biogen, Caterpillar, Ryanair, Crane Co., Seagate Technology, Steel Dynamics, VMWare, Yahoo, and Zions Bancorporation.
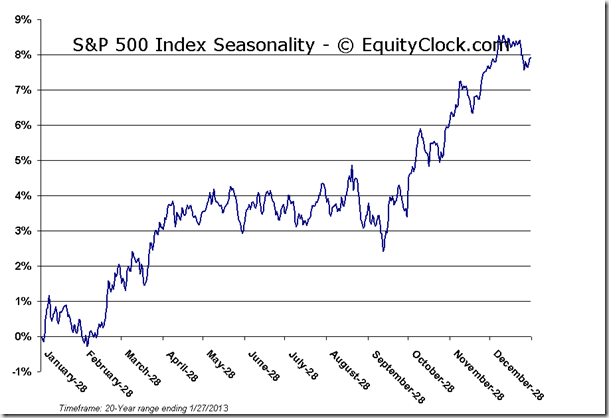
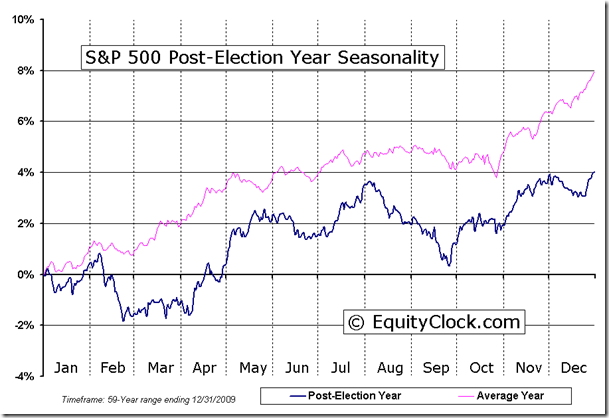
From a seasonal perspective, during post-presidential election years the market has shown losses on average once earnings season concludes into the start of February. Losses top 2% between the end of the first week of February through to the last couple of days of the month. From there, the market typically bottoms between the end of February and into March, rebounding higher in April and May. Given the extent to which equity markets are overbought, some sort of pullback seems likely into February once the earnings season catalyst comes to an end. This seasonal weakness during post-election years results from the president implementing much of the tough decisions according to his campaigned-upon mandate. With deficit reduction talks continuing over the months ahead and the two key political parties remaining firm on varying degrees of balance between revenues and spending, politics could once again influence the market according to the average tendency during equivalent years.
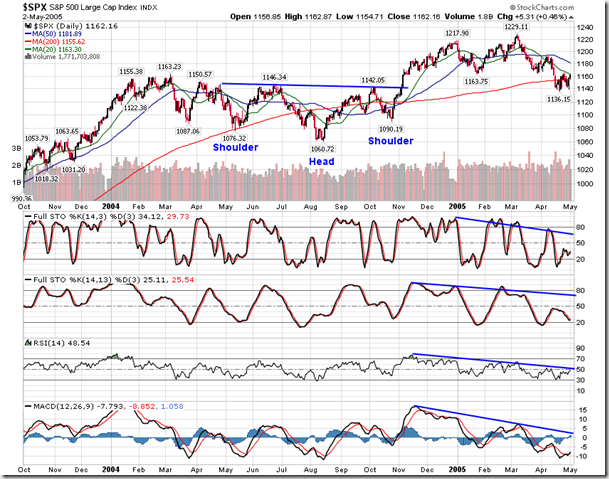
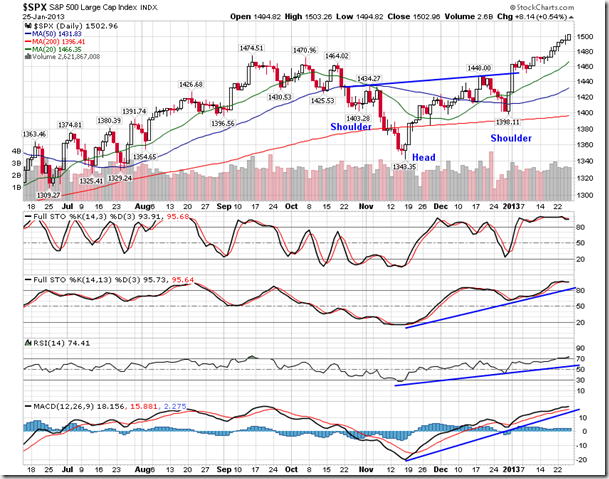
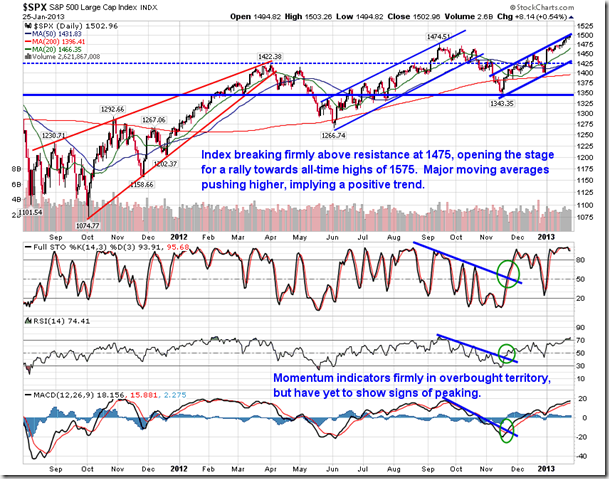
Friday’s equity market gain was the eighth straight session that the S&P 500 ended with a positive return, an event that was last realized in November of 2004. During that period in 2004 it was not until the 10th day that the market actually realized a declining session. The loss for the session was a mere 0.11%. The market went on to gain an additional 4.5% over the seven weeks that followed, even though the benchmark was overbought following the tremendous eight day run. Back in 2004, the large cap benchmark broke out of a significant reverse head-and-shoulders pattern that suggested an approximate 80-point move from the neckline of around 1140; this 1220 target came close to being achieved in just less than two months following neckline breakout. A similar reverse head-and-shoulders pattern is obvious on the present day chart with an almost similar 90-point move targeted from the neckline around 1440, implying the bullish pattern will be completed around 1530. Negative momentum divergences back in 2004 gave indication that some kind of intermediate peak was being realized following the completion of the bullish pattern; the present day chart has yet to realize a similar divergence.
2004 Chart:
2012/2013 Chart:
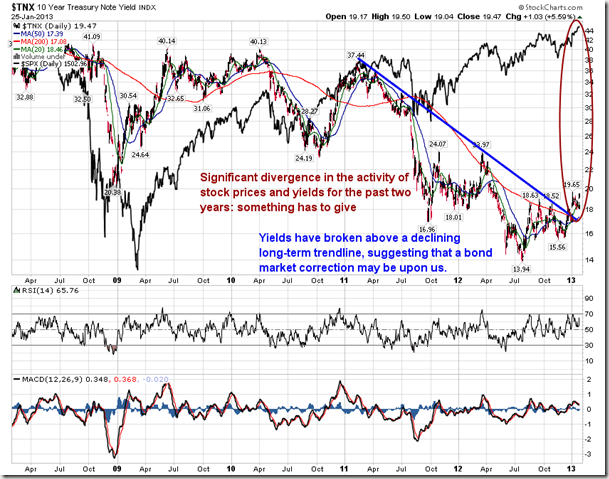
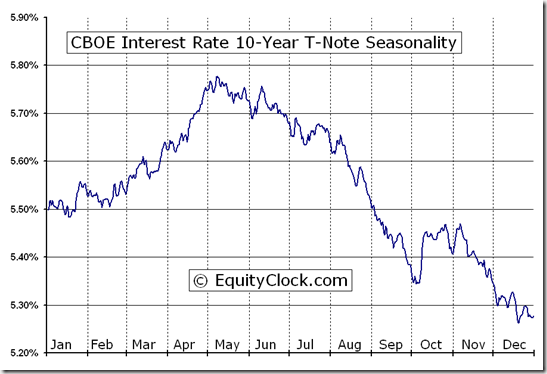
While funds continue to flow into stocks, money continues to move away from the bond market, particularly treasuries that have seen yields spike almost 400 basis points since the start of December. Treasury yields have broken firmly above a long-term declining trendline that had remained intact for almost two years, diverging from the positive trend of equity markets over the same period. The correlation of yields to equity market activity looks to be returning as the cost of borrowing retraces the significant declines that have occurred amidst an equity market rally. Rising yields is, in fact, healthy for equity markets as it is indicative that investor fear/risk aversion is lessening and confidence is growing, forcing a reallocation away from fixed income assets and into stocks. Further bond market participation in the equity market rally could fuel the next leg higher in stocks. Treasury bond prices remain seasonally weak between now and the end of April, meaning that yields customarily increase, on average, over this period.
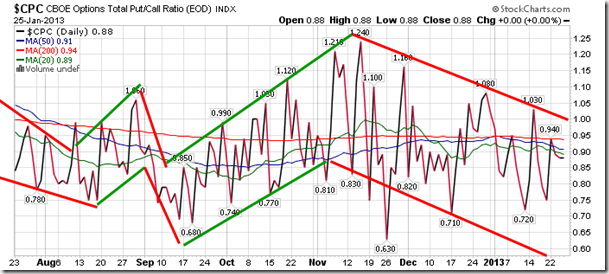
Sentiment on Friday, as gauged by the put-call ratio, ended bullish at 0.88. The ratio remains in a bullish trend as investors become less cautious with the use of put options.
Chart Courtesy of StockCharts.com
Chart Courtesy of StockCharts.com
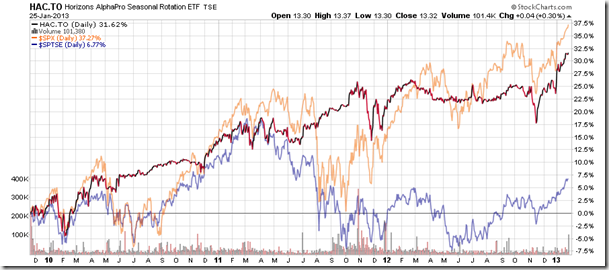
Horizons Seasonal Rotation ETF (TSX:HAC)
- Closing Market Value: $13.32 (up 0.30%)
- Closing NAV/Unit: $13.32 (up 0.33%)
Performance*
| 2013 Year-to-Date | Since Inception (Nov 19, 2009) | |
| HAC.TO | 4.74% | 33.2% |
* performance calculated on Closing NAV/Unit as provided by custodian
| 2013 Year-to-Date | Since Inception (Nov 19, 2009) | |
| HAC.TO | 4.74% | 33.2% |
* performance calculated on Closing NAV/Unit as provided by custodian
Click Here to learn more about the proprietary, seasonal rotation investment strategy developed by research analysts Don Vialoux, Brooke Thackray, and Jon Vialoux.
Copyright © TechTalk


