by Don Vialoux, TechTalk
Pre-opening Comments
U.S. equity index futures are higher this morning. S&P 500 futures are up 8 points in pre-opening trade. Index futures are responding to news that Chinese exports rose 14% on a year-over-year basis versus consensus for a 5% gain. Commodity prices moved higher on the news. Crude oil gained $1.34 per barrel, copper added $0.04 per lb., gold improved $16.00 per ounce and silver improved $0.48 per ounce.
The Bank of England maintained its overnight lending rate at 0.5%. The European Central Bank maintained its overnight lending rate at 0.75%.
Index futures were virtually unchanged after releasing worse than expected Weekly Initial Jobless Claims. Consensus was 361,000 versus a revised 367,000. Actual was 371,000.
Ford added $0.43 to $13.90 after doubling its quarterly dividend to $0.10 per share.
Alcoa (AA $9.08) is expected to open lower after Macquarie downgraded the stock from Neutral to Under Perform. Target was reduced from $9 to $6.
Altria added $0.32 to $32.22 after Stifel Nicolaus upgraded the stock from Hold to Buy.
U.S. railway stocks are expected to open lower after Goldman Sachs and Raymond James downgraded the sector. Goldman Sachs downgraded Norfolk Southern (NSC $64.75) and CSX (20.54) from Buy to Neutral. Raymond James downgraded Norfolk Southern and CSX from Outperform to Neutral.
Hudson’s Bay Company (HBC $17.00) is expected to open higher after Credit Suisse initiated coverage on the stock with an Outperform rating.
AIG (AIG $35.76) is expected to open lower after Wells Fargo downgraded the stock from Outperform to Market Perform.
Weekly Select Sector SPDRs Review
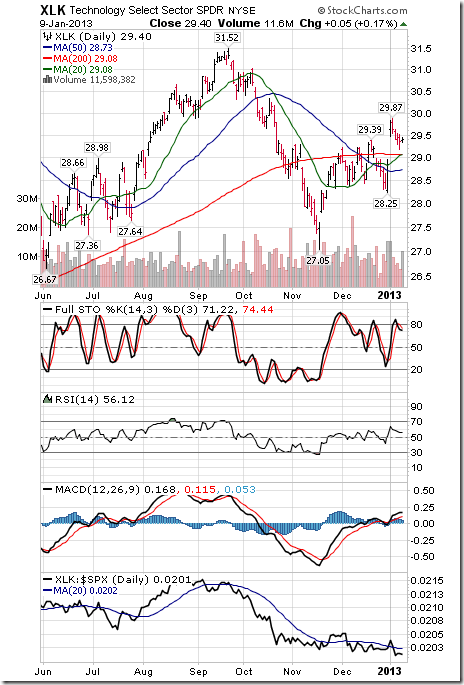
Technology
· Intermediate trend is up.
· Units remain above their 20, 50 and 200 day moving averages
· Short term momentum indicators are overbought
· Strength relative to the S&P 500 Index has returned to neutral with negative tendencies
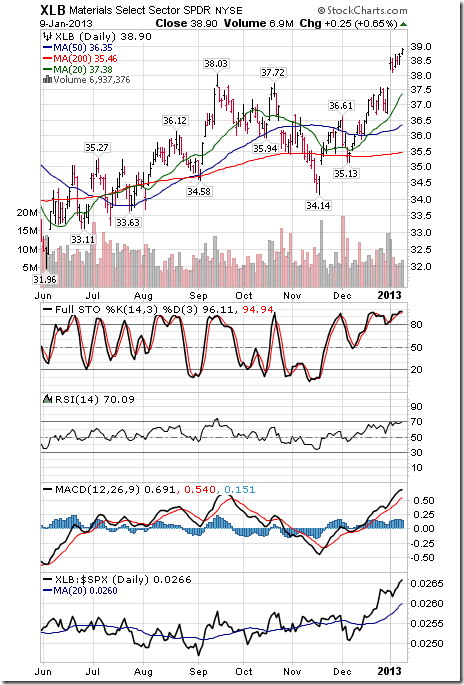
Materials
· Intermediate trend is up. Units reached closed at another 17 month high
· Units remain above their 20, 50 and 200 day moving averages
· Short term momentum indicators are overbought
· Strength relative to the S&P 500 Index remains positive.
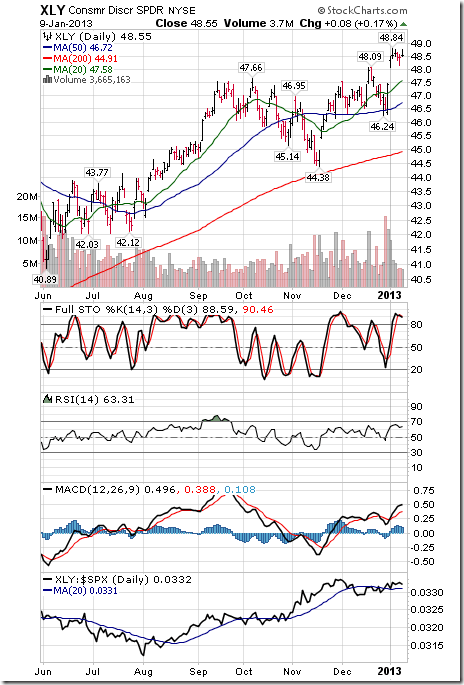
Consumer Discretionary
· Intermediate trend is up. Closed just below its all-time high at $48.84
· Units remain above their 20, 50 and 200 day moving averages
· Short term momentum indicators are overbought.
· Strength relative to the S&P 500 Index remains neutral.
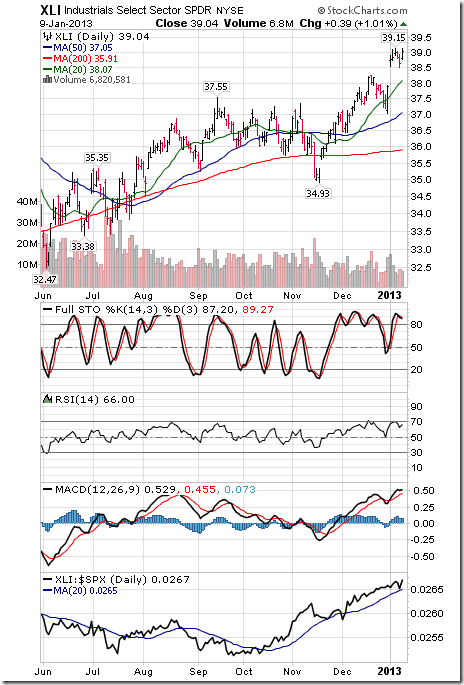
Industrials
· Intermediate trend is up. Units closed at an all-time closing high.
· Units remain above their 20, 50 and 200 day moving averages
· Short term momentum indicators are overbought
· Strength relative to the S&P 500 Index remains positive
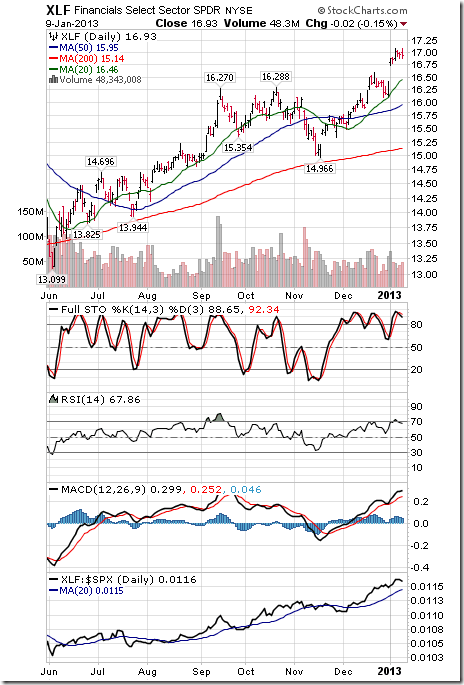
Financials
· Intermediate trend is up. Units closed just below a four year high.
· Units remain above their 20, 50 and 200 day moving averages
· Short term momentum indicators are overbought.
· Strength relative to the S&P 500 Index remains positive
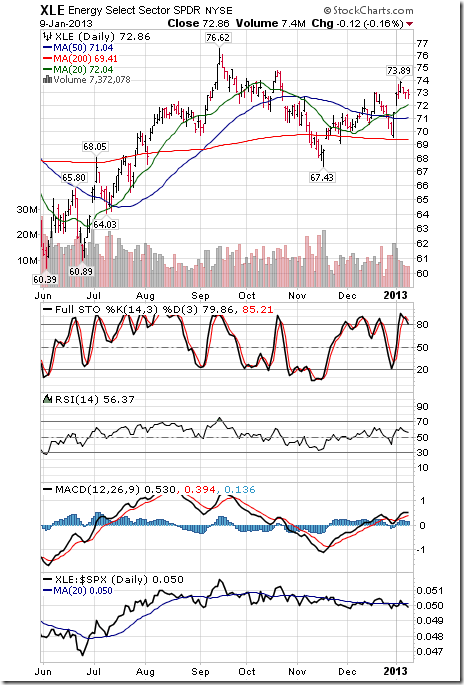
Energy
· Intermediate trend changed from neutral to positive on a break above resistance at $73.02
· Remains above its 20, 50 and 200 day moving averages
· Short term momentum indicators are overbought
· Strength relative to the S&P 500 Index remains neutral, but showing early signs of turning positive
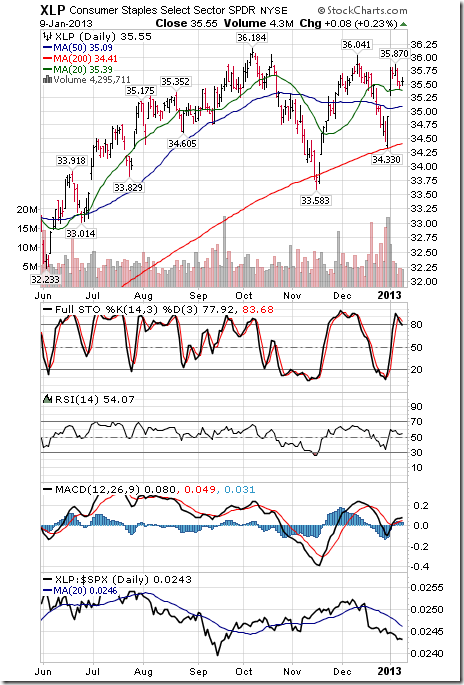
Consumer Staples
· Intermediate trend is neutral.
· Units remain above their 20, 50 and 200 day moving averages
· Short term momentum indicators are overbought
· Strength relative to the S&P 500 Index remains negative
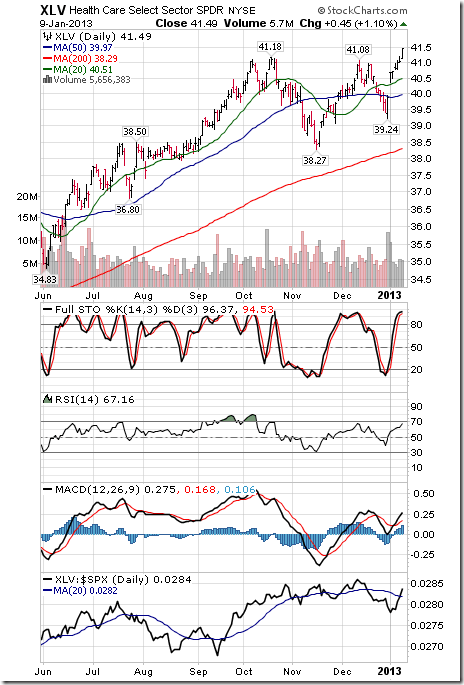
Health Care
· Intermediate trend changed from neutral to up when units broke above resistance at $41.18 to close at an all-time high.
· Units remain above their 20, 50 and 200 day moving averages
· Short term momentum indicators are overbought
· Strength relative to the S&P 500 Index has changed from negative to neutral.
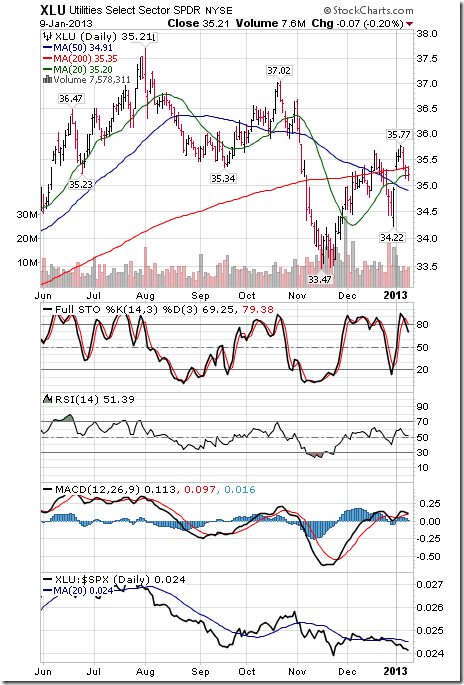
Utilities
· Intermediate trend changed from up to down on a break above $35.67.
· Units fell below their 20 and 200 day moving average yesterday
· Short term momentum indicators are overbought
· Strength relative to the S&P 500 Index remains negative.
Thackray’s 2013 Investor’s Guide
Thackray’s 2013 Investor’s Guide is here. Order through www.alphamountain.com , Amazon, Chapters or Books on Business.
Special Free Services available through www.equityclock.com
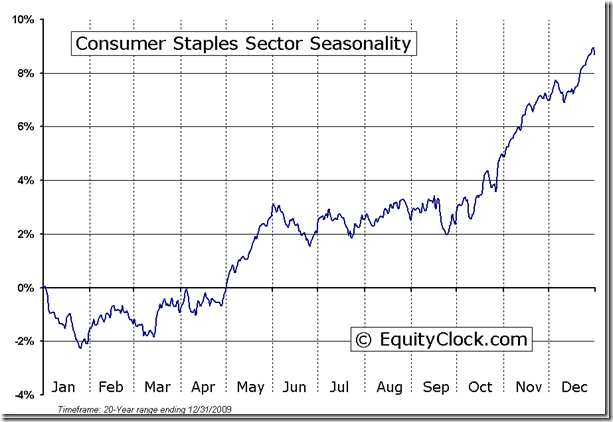
Equityclock.com is offering free access to a data base showing seasonal studies on individual stocks and sectors. The data base holds seasonality studies on over 1000 big and moderate cap securities and indices.
To login, simply go to http://www.equityclock.com/charts/
Following is an example:
Consumer Staples Sector Seasonal Chart
Disclaimer: Comments and opinions offered in this report at www.timingthemarket.ca are for information only. They should not be considered as advice to purchase or to sell mentioned securities. Data offered in this report is believed to be accurate, but is not guaranteed.
Don and Jon Vialoux are research analysts for Horizons Investment Management Inc. All of the views expressed herein are the personal views of the authors and are not necessarily the views of Horizons Investment Management Inc., although any of the recommendations found herein may be reflected in positions or transactions in the various client portfolios managed by Horizons Investment Management Inc
Horizons Seasonal Rotation ETF HAC January 9th 2013
Copyright © TechTalk



![clip_image002[5] clip_image002[5]](https://advisoranalyst.com/wp-content/uploads/HLIC/f9eec5efc015fa69176c2b2ed5f14823.png)


