Should I invest in commodities?
For this weeks Equity Leaders Weekly, we are going take a closer look at the relationship between U.S. Equity and two commodity ETFs: Gold and Crude Oil. These comparisons should give us some more technical insight into where the strength is in the markets and if there is any attractive opportunities in commodities with many media sources bullish towards them. With the SIA Asset Allocation Model continuing to have U.S. Equity in the #1 spot and Commodities ranked in the lowest spot, looking at these charts will help to reflect the Asset Allocation and our positioning.
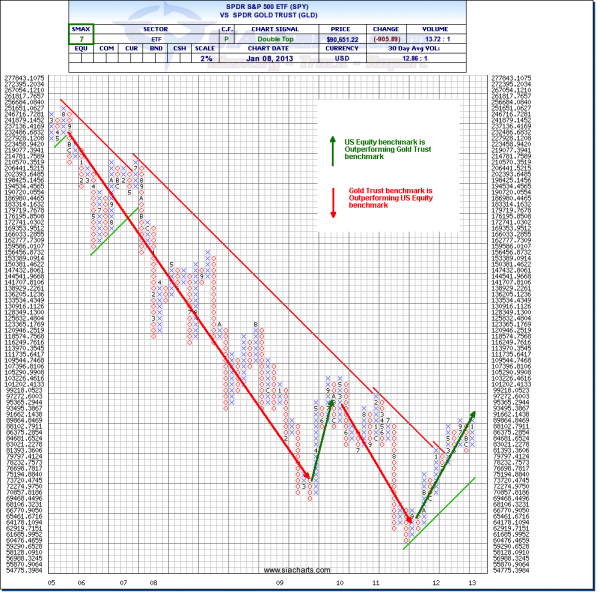
SPDR S&P 500 ETF vs. SPDR Gold Trust (SPY vs. GLD) (click on charts for enlargement)
The comparison chart to the right shows the long-term periods of strength of Gold over the U.S. Equity markets from late 2005 to March of 2009 and from the middle of 2010 to September of 2011. Over the past 8 years, an investment in Gold would have nicely outperformed investing in U.S, Equity. However, a significant trend reversal has happened in favor of U.S. Equity since September of 2011 where it has broken through the downwards trend line in place since 2005. With a comparative SMAX score of 7 in favor of U.S. Equity, the long-term outlook still looks to favor U.S. Equity over Gold.
Note: If want to take a closer look at Gold Continuous Contract (GC.F), it has been range bound between resistance at $1820.78 at the top and $1523.55 at the bottom since the comparison in 2011 has favored U.S. Equity. Contact SIACharts at siateam@siacharts.com for more information or to see this chart.
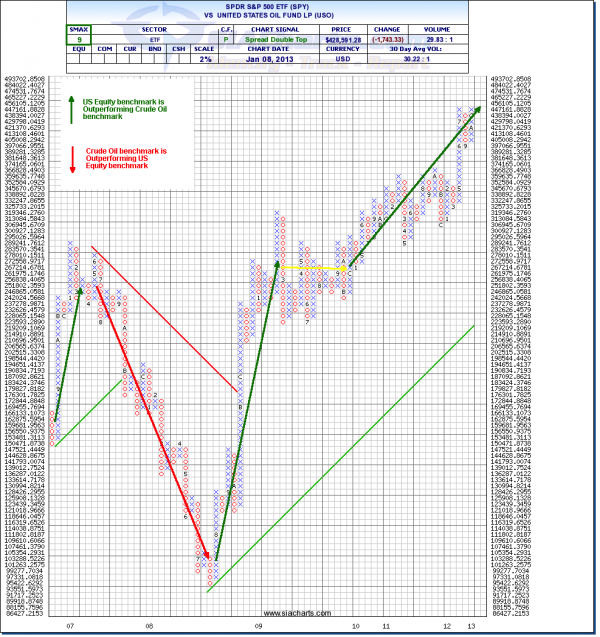
SPDR S&P 500 ETF vs. United States Oil Fund LP (SPY vs. USO)
The second comparison chart is looking at the relationship between U.S. Equity and Crude Oil. Crude Oil was winning this comparative battle mainly from July of 2007 to July of 2008, but besides this period, U.S. Equity has been the stronger relative performer. You can also see in the chart that the long-term trend line has been in place since late 2008 in favor of U.S. Equity. Going forward, the comparative SMAX score of 9 favors U.S. Equity over Crude Oil.
These comparisons show a snapshot of why commodities don't seem as bullish in the long-term as many writers may suggest, so it is important to keep a technical eye on these comparisons to see if a material change occurs and if U.S. Equity continues to be favored over the other asset classes.


