by Don Vialoux, et al, TechTalk
Pre-opening Comments for Monday January 7th
U.S. equity index futures are lower this morning. S&P 500 futures are down 2 points in pre-opening trade. Index futures are responding to strength in the U.S. Dollar.
Yahoo slipped $0.28 to $19.58 after Bernstein downgraded the stock from Outperform to Market Perform.
Intel added $0.13 to $21.29 after Lazard Capital upgraded the stock from Neutral to Buy. Target is $26.
Applied Materials (AMAT $11.81) is expected to open lower after JP Morgan downgraded the stock from Neutral to Underweight.
Broadcom gained $0.14 to $34.58 after Evercore initiated coverage with an Overweight rating.
New York Mellon (BK $27.20) is expected to open lower after Goldman Sachs downgraded the stock from Neutral to Sell.
Jon Vialoux on Market Call on BNN on Friday
Top picks are JJC, IWM and XES.
Following is a link to the interview:
http://watch.bnn.ca/#clip837370
http://watch.bnn.ca/#clip837374
http://watch.bnn.ca/#clip837377
http://watch.bnn.ca/#clip837369
Economic News This Week
December Canadian Housing Starts to be released at 8:15 AM EST on Wednesday is expected to slip 0.6% from November.
Weekly Initial Jobless Claims to be released at 8:30 AM EST on Thursday are expected to slip to 361,000 from 372,000 last year.
November U.S. Trade Deficit to be released at 8:30 AM EST on Friday is expected to slip to $41.2 billion from $42.2 billion in October.
November Canadian Merchandise Trade to be released at 8:30 AM EST on Friday is expected to show an increase in deficit to $700 million versus a deficit of 170,000 in October.
Earnings News This Week
Tuesday: Alcoa, Monsanto
Thursday: SuperValu
Friday: Wells Fargo
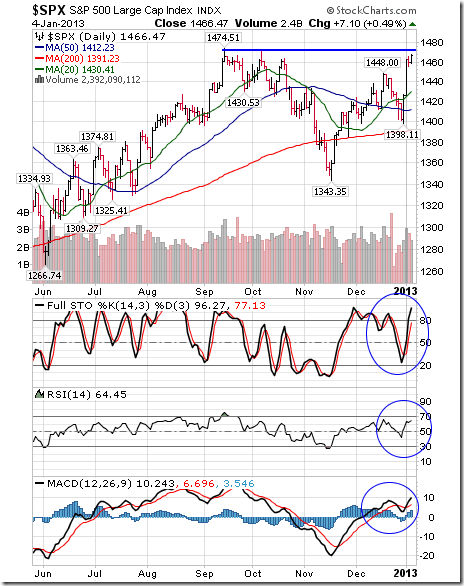
The S&P 500 Index gained 64.04 points (4.56%) last week. Intermediate trend changed from neutral to up on a break above 1,448.00. The Index remains above its 200 day moving average and moved above its 20 and 50 day moving average last week. Short term momentum indicators are overbought, but have yet to show signs of peaking.
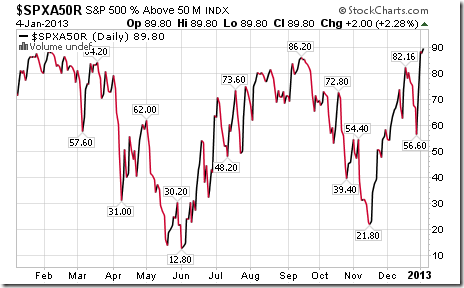
Percent of S&P 500 stocks trading above their 50 day moving average increased last week to 89.80% from 56.60%. Percent is intermediate overbought.
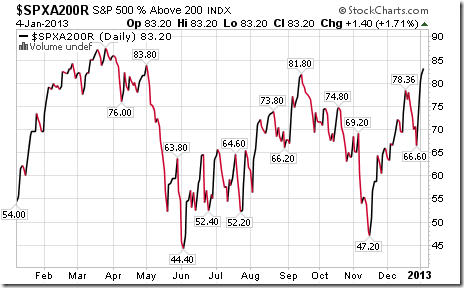
Percent of S&P 500 stocks trading above their 200 day moving average increased last week to 83.20% from 66.60%. Percent remains intermediate overbought.
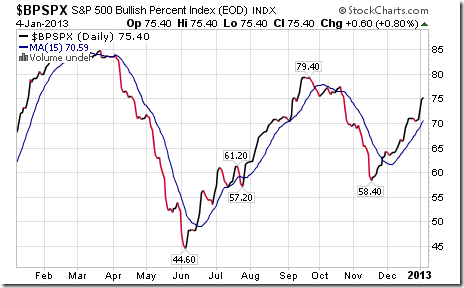
Bullish Percent Index for S&P 500 stocks increased last week to 75.40% from 70.60% and remained above its 15 day moving average. The Index remains intermediate overbought.
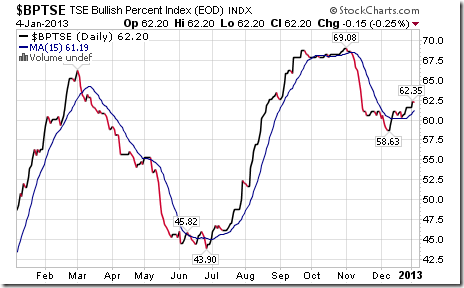
Bullish Percent Index for TSX Composite stocks increased last week to 62.20% from 61.54% and remained above its 15 day moving average. The Index remains intermediate overbought.
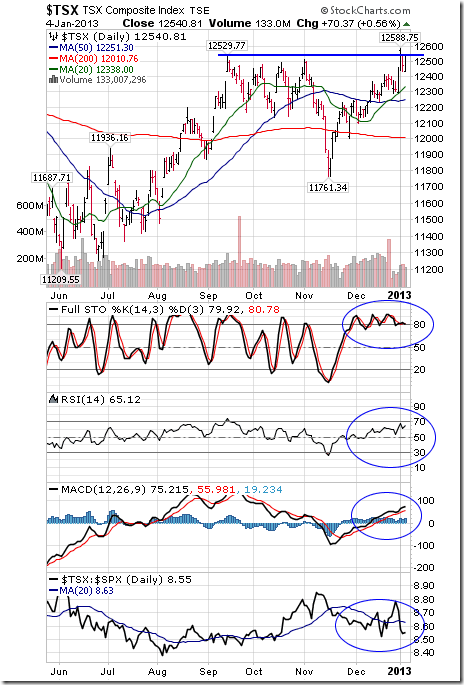
The TSX Composite Index gained 224.69 points (1.82%) last week. An intermediate uptrend was confirmed on a break above resistance at 12,529.77 to a nine month high. The Index remains above its 20, 50 and 200 day moving averages. Short term momentum indicators are overbought, but have yet to show signs of peaking. Strength relative to the S&P 500 Index changed back to neutral from positive.
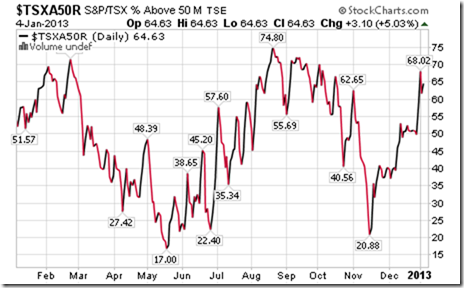
Percent of TSX stocks trading above their 50 day moving average increased last week to 64.63% from 49.80%. Percent has returned to an intermediate overbought level.
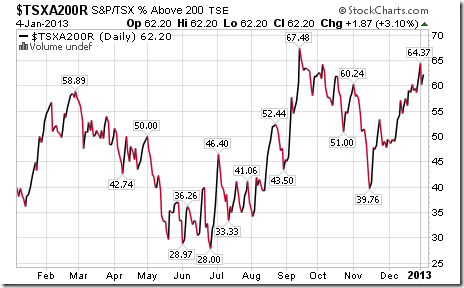
Percent of TSX stocks trading above their 200 day moving average increased last week to 62.20% from 58.70%. Percent remains intermediate overbought.
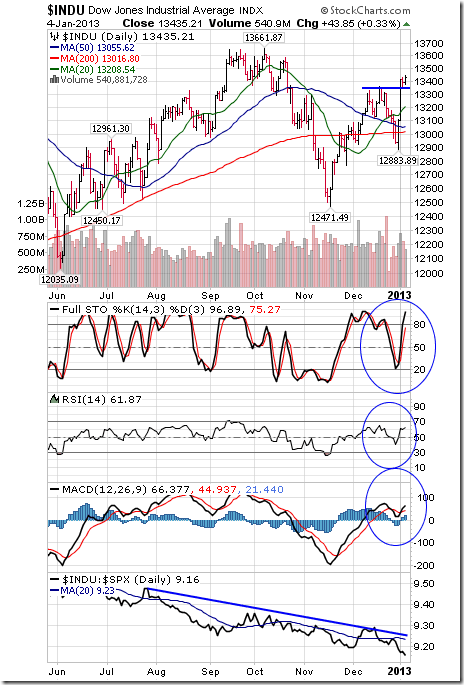
The Dow Jones Industrial Average added 497.10 points (3.84%) last week. Intermediate trend changed from neutral to up on a break above resistance at 13,365.86. The Average moved above its 20, 50 and 200 day moving averages. Short term momentum indicators are overbought. Strength relative to the S&P 500 Index changed from neutral to negative.
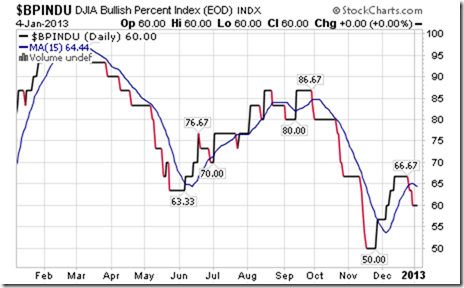
Bullish Percent Index for Dow Jones Industrial Average stocks slipped last week to 60.00% from 63.33% and remained below its 15 day moving average.
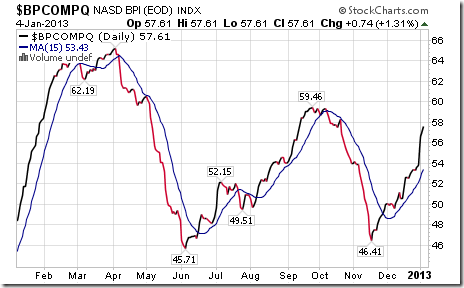
Bullish Percent Index for NASDAQ Composite stocks increased last week to 57.61% from 53.56% and remained above its 15 day moving average.
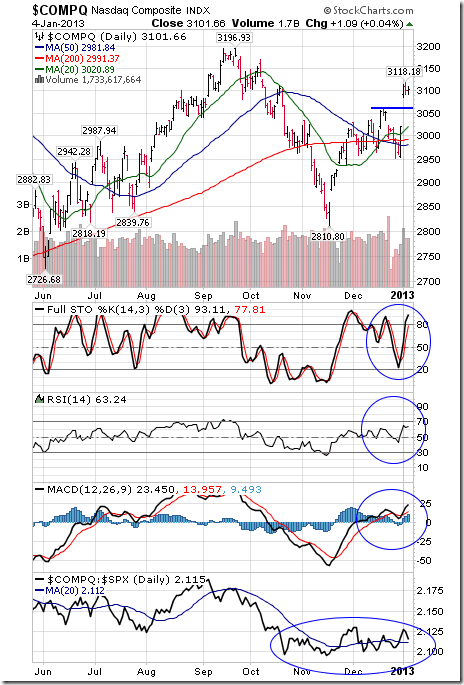
The NASDAQ Composite Index gained 141.35 points (4.77%) last week. Intermediate trend changed from neutral to up on a break above resistance at 3,061.82. The Index moved above its 20, 50 and 200 day moving averages. Short term momentum indicators are overbought, but have yet to show signs of peaking. Strength relative to the S&P 500 Index remains neutral.
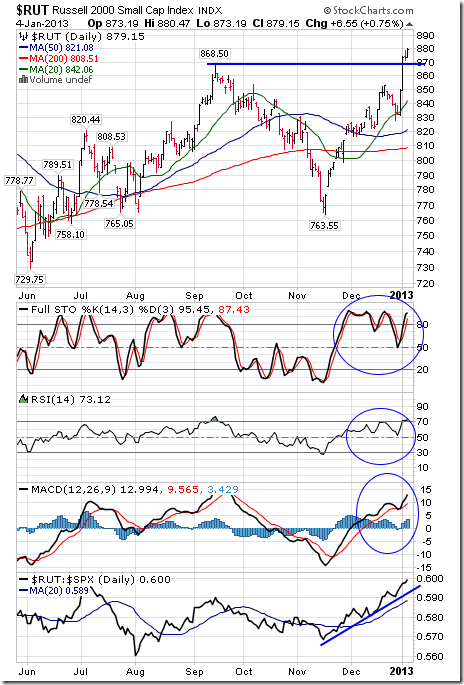
The Russell 2000 Index gained 47.05 points (5.65%) last week. An intermediate uptrend was confirmed when the Index broke above resistance at 868.50 to reach an all-time high. The Index remains above its 50 and 200 day moving averages and moved above its 20 day moving average. Short term momentum indicators are overbought, but have yet to show signs of peaking. Strength relative to the S&P 500 Index remains positive.
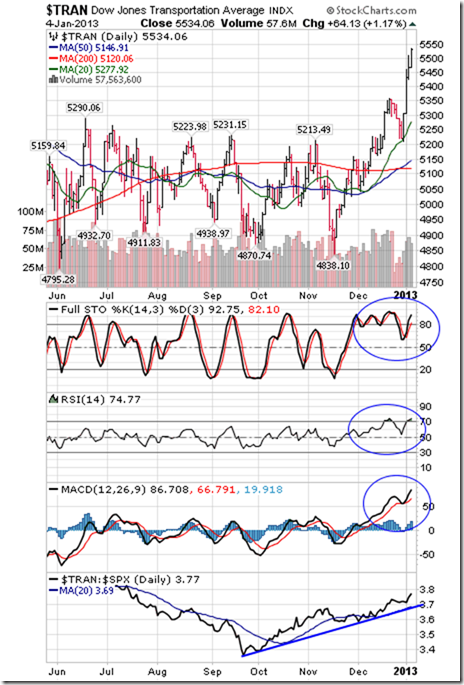
The Dow Jones Transportation Average gained 313.08 points (6.00%) last week. Intermediate trend is up. The Average remains above its 20, 50 and 200 day moving averages. Short term momentum indicators are overbought, but have yet to show signs of peaking. Strength relative to the S&P 500 Index remains positive.
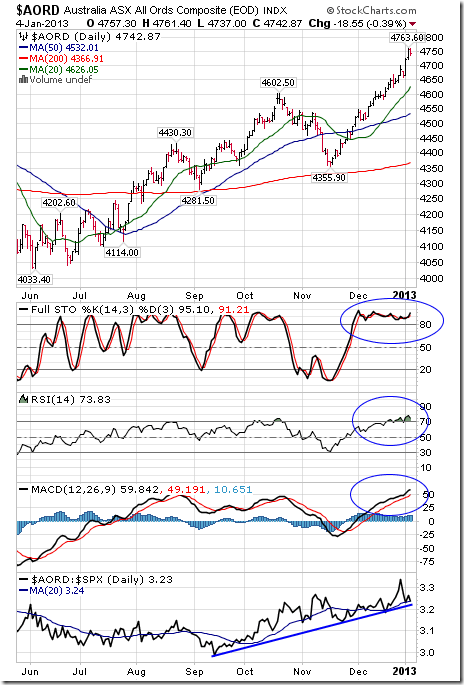
The Australia All Ordinaries Composite Index added 57.60 points (1.23%) last week. Intermediate trend is up. The Index remains above its 20, 50 and 200 day moving averages. Short term momentum indicators are overbought, but have yet to show signs of peaking. Strength relative to the S&P 500 Index remains positive.
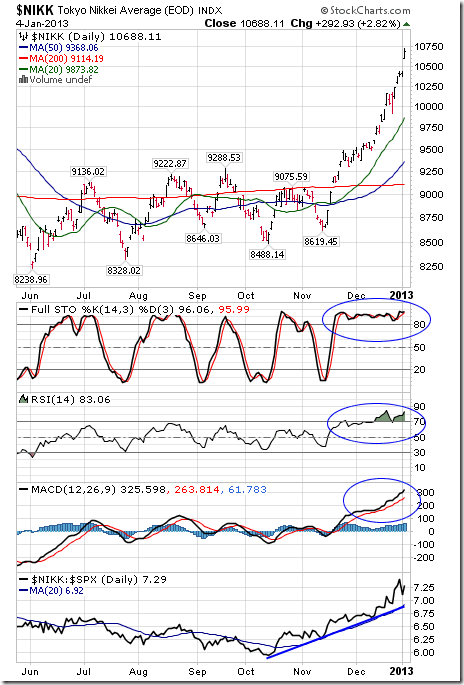
The Nikkei Average gained another 292.93 points (2.82%) last week. Intermediate trend is up. The Index remains above its 20, 50 and 200 day moving averages. Short term momentum indicators are overbought, but have yet to show signs of peaking. Strength relative to the S&P 500 Index remains positive.
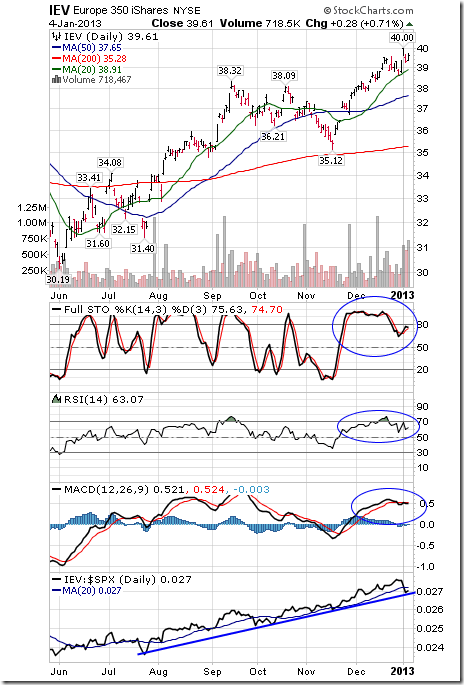
Europe 350 iShares gained $0.97 (2.51%) last week. Intermediate trend is up. Units remain above their 20, 50 and 200 day moving averages. Short term momentum indicators are overbought and showing early signs of rolling over. Strength relative to the S&P 500 Index remains positive, but showing early signs of change.
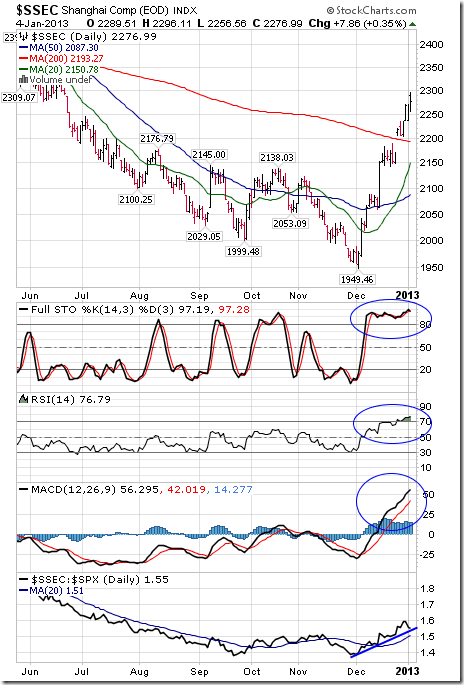
The Shanghai Composite Index added another 43.74 points (1.96%) last week. The Index remains above its 20, 50 and 200 day moving averages. Short term momentum indicators are overbought, but have yet to show signs of peaking. Strength relative to the S&P 500 Index remains positive.
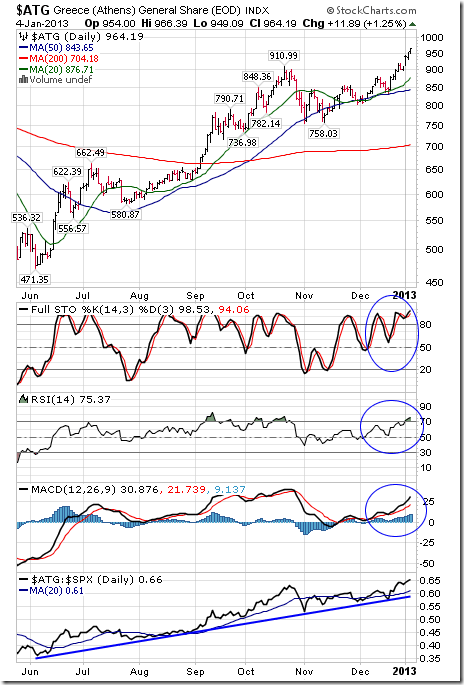
The Athens Index added another 62.83 points (6.97%) last week. Intermediate trend is up. The Index remains above its 20, 50 and 200 day moving averages. Short term momentum indicators are overbought, but have yet to show signs of peaking. Strength relative to the S&P 500 Index remains positive.
Currencies
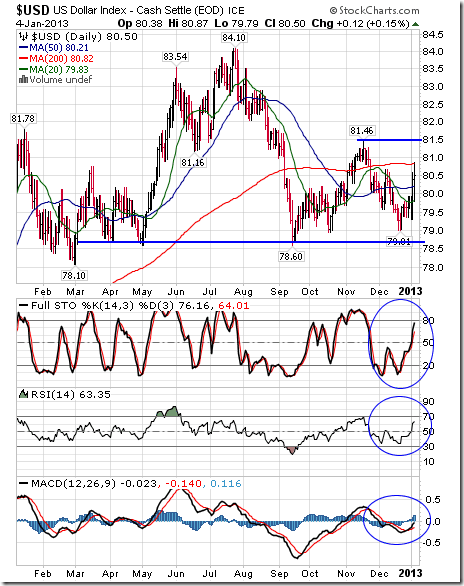
The U.S. Dollar Index gained 0.82 (2.91%) last week. Support is at 78.60 and resistance is at 81.46. The Dollar moved above its 20 and 50 day moving averages. Short term momentum indicators are trending up.
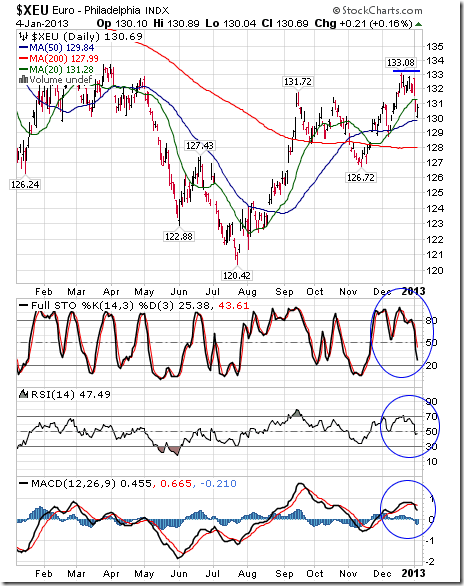
The Euro fell 1.44 (1.13%) last week. Resistance has formed at 133.08. The Euro fell below its 20 day moving average. Short term momentum indicators are trending down.
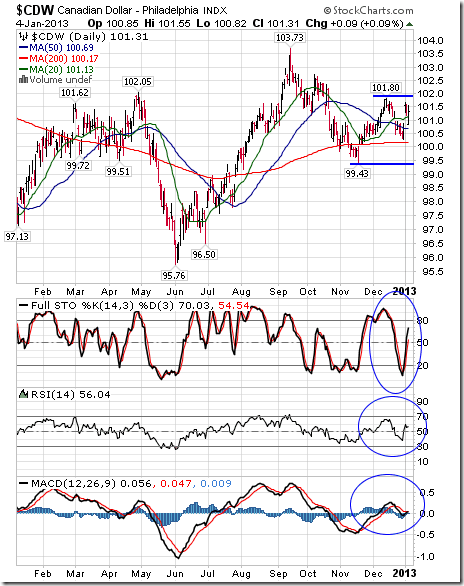
The Canadian Dollar gained 0.98 cents U.S. (2.91%) last week. Intermediate trend is down. Support is at 99.43 and resistance is at 101.80. The Canuck Buck moved above its 20 and 50 day moving averages. Short term momentum indicators are trending up.
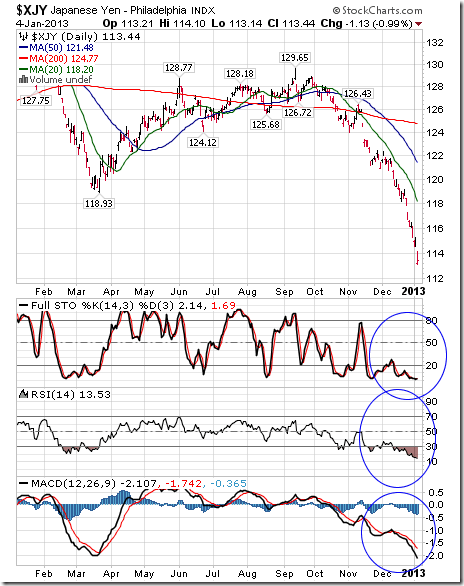
The Japanese Yen fell another 2.95 (2.53%) last week. Intermediate trend is down. The Yen remains below its 20, 50 and 200 day moving averages. Short term momentum indicators are oversold, but have yet to show signs of bottoming.
Commodities
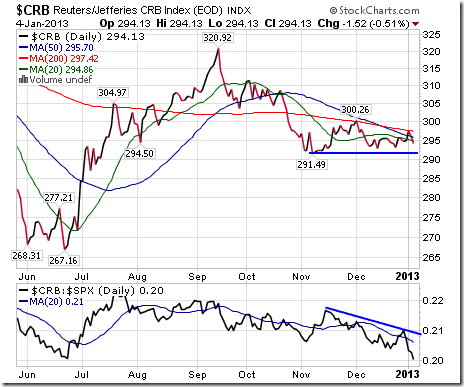
The CRB Index slipped 0.65 (0.22%) last week. Intermediate trend is down. The Index remains below its 20, 50 and 200 day moving averages. Support is at 291.49 and resistance is at 300.26. Strength relative to the S&P 500 Index changed from neutral to negative.
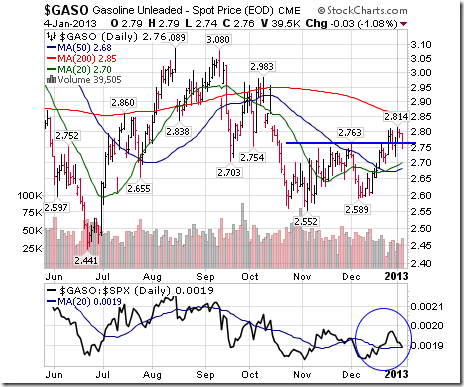
Gasoline was unchanged last week. Intermediate trend is up. Gasoline remains above its 20 and 50 day moving averages. Strength relative to the S&P 500 Index changed from positive to neutral.
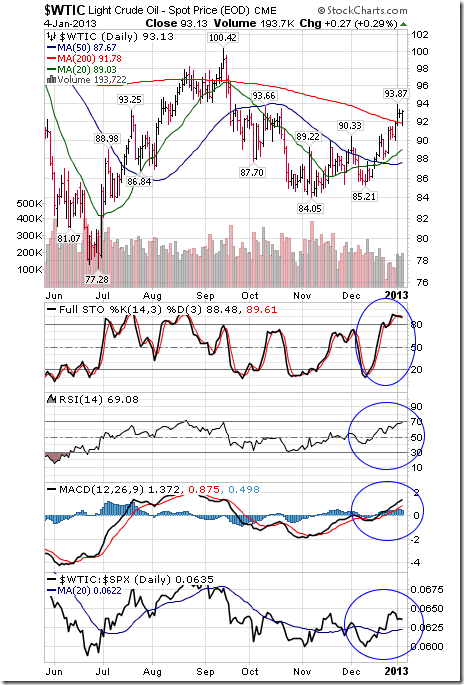
Crude Oil gained $2.51 (2.77%) last week. Intermediate trend is up. Crude remains above its 20 and 50 day moving averages and moved above its 200 day moving average. Short term momentum indicators are overbought, but have yet to show signs of peaking. Strength relative to the S&P 500 Index remains positive.
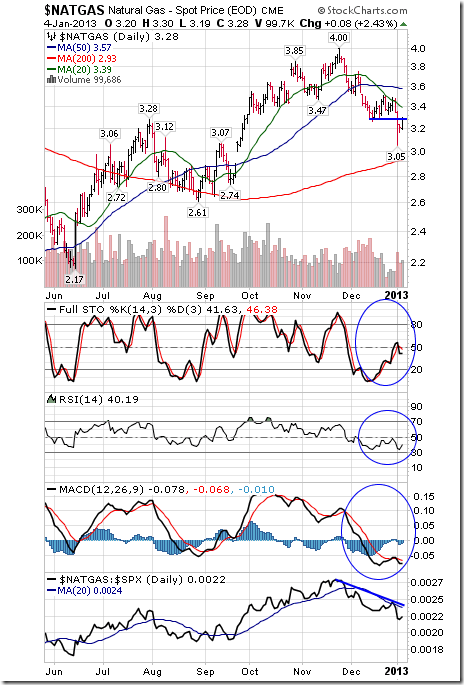
Natural Gas fell $0.18 per MBtu (5.20%) last week. Intermediate downtrend was confirmed by a break below support at $3.26. Natural Gas remains below its 20 and 50 day moving averages. Short term momentum indicators are neutral. Strength relative to the S&P 500 Index returned to negative to neutral.
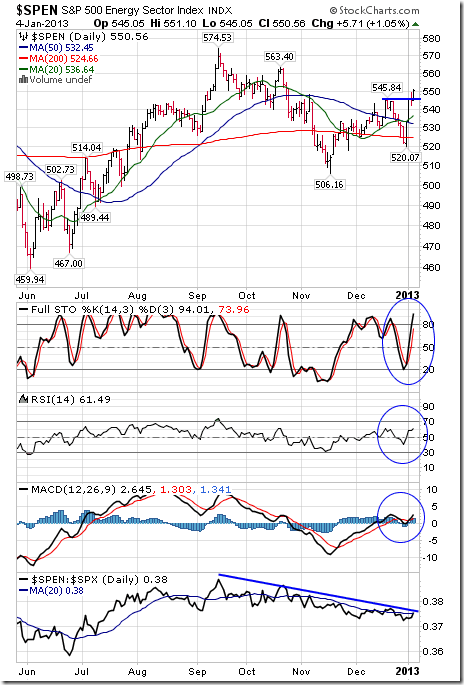
The S&P Energy Index added 28.53 points (5.47%) last week. Intermediate trend changed from neutral to up on a break above resistance at 545.84. The Index moved above its 20, 50 and 200 day moving averages. Short term momentum indicators are trending up. Strength relative to the S&P 500 Index is negative, but showing early signs of change.
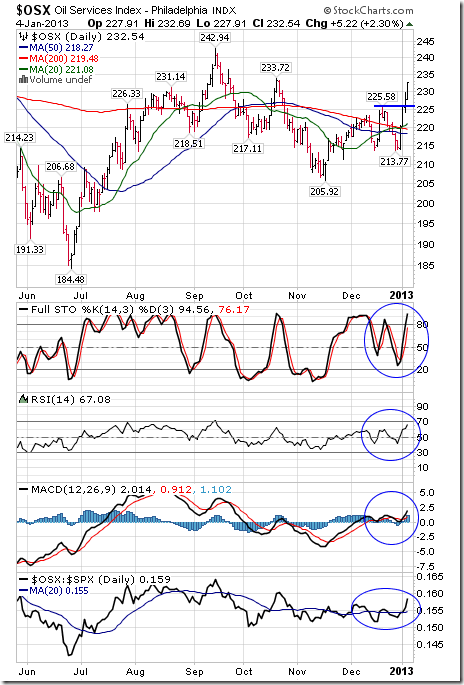
The Philadelphia Oil Services Index gained 17.94 points (8.36%) last week. Intermediate trend changed from down to up on a break above resistance at 225.58. The Index moved above its 20, 50 and 200 day moving averages. Short term momentum indicators are overbought, but have yet to show signs of peaking. Strength relative to the S&P 500 Index changed from negative to positive.
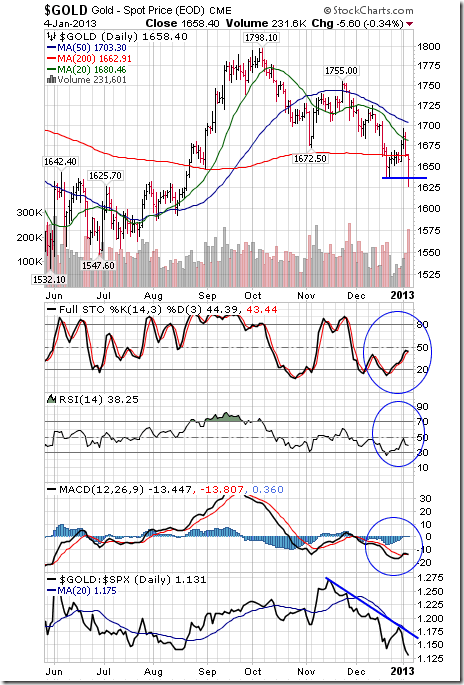
Gold was unchanged last week. Intermediate trend is down. Gold briefly broke support at $1,636.00 on Friday. Gold remains below its 20, 50 and 200 day moving averages. Short term momentum indicators are oversold and trying to recover. Strength relative to the S&P 500 Index remains negative.
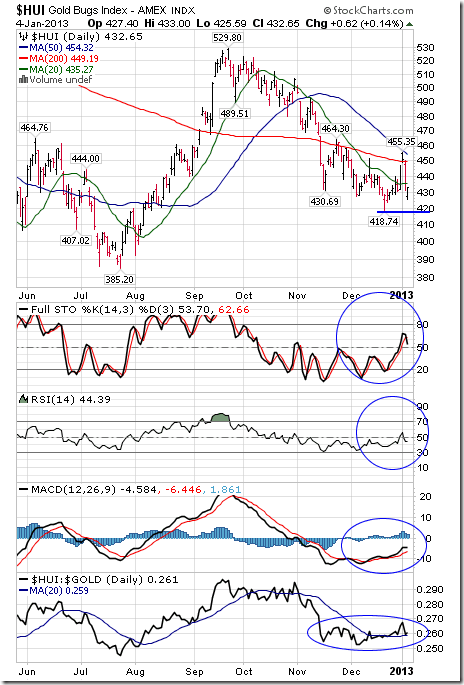
The AMEX Gold Bug Index added 1.74 points (0.40%) last week. Intermediate trend changed from down to neutral on a break above resistance at 451.48. Support has formed at 418.74. The Index remains below its 20, 50 and 200 day moving averages. Short term momentum indicators are recovering from oversold levels. Strength relative to gold remains neutral, but showing early signs of improvement.
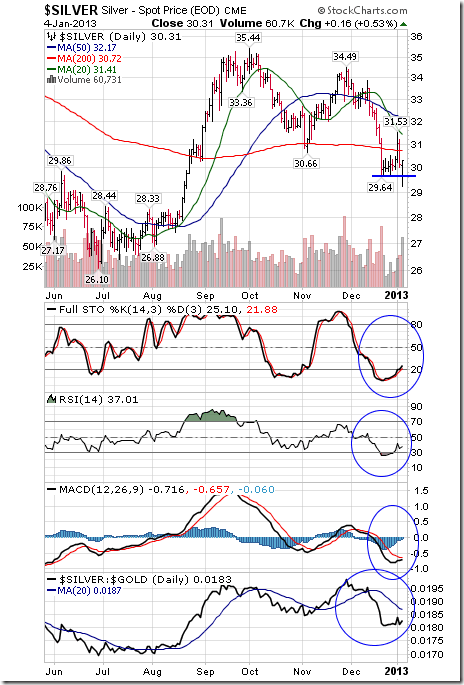
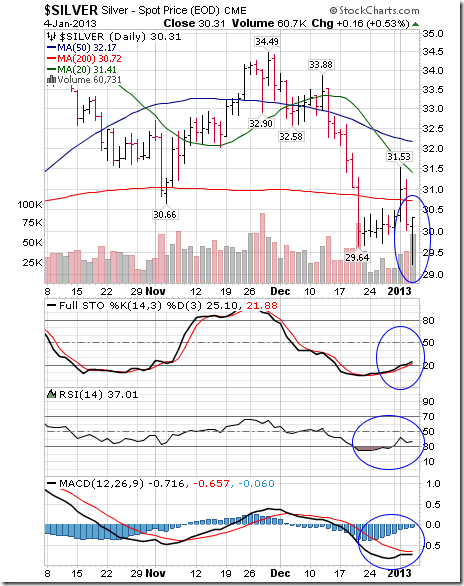
Silver added $0.20 (0.66%) last week. Intermediate trend is down. Silver remains below its 20, 50 and 200 day moving averages. Short term momentum indicators are bottoming at oversold levels. Strength relative to gold is negative, but showing early signs of improvement. Note the reversal on Friday. More information on silver is offered later in this report.
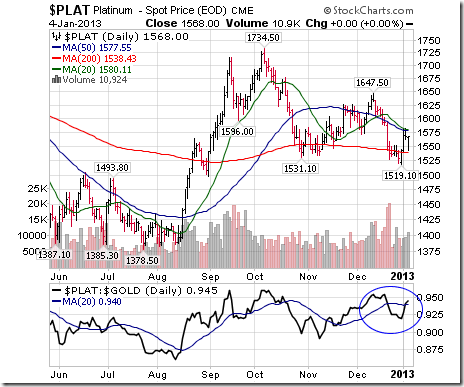
Platinum gained $39.80 per ounce (2.60%) last week. Intermediate trend is down. The Index remains below its 20 and 50 day moving averages, but moved above its 200 day moving average. Strength relative to gold has changed from negative to at least neutral.
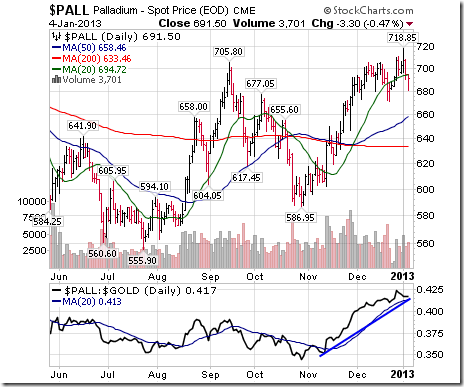
Palladium slipped $7.50 per ounce (1.07%) last week. Intermediate uptrend is up. Palladium fell below its 20 day moving average on Friday. Strength relative to gold remains positive.
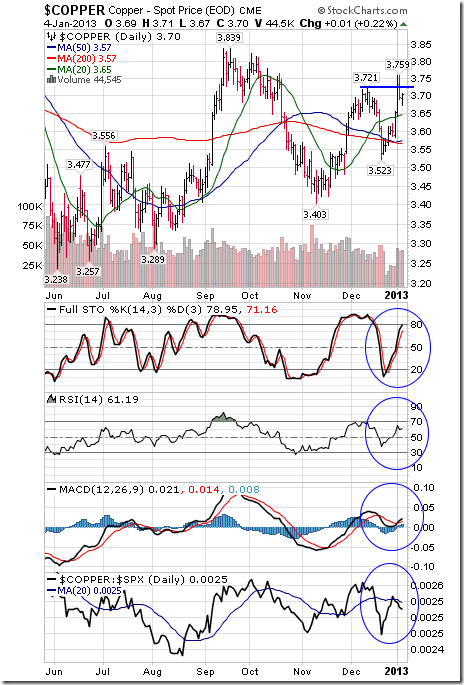
Copper added $0.10 per lb. (2.78%) last week. Intermediate uptrend was confirmed on a break above resistance at $3.721. Copper remains above its 50 and 200 day moving averages and moved above its 200 day moving average. Short term momentum indicators are trending up. Strength relative to the S&P 500 Index remains neutral.
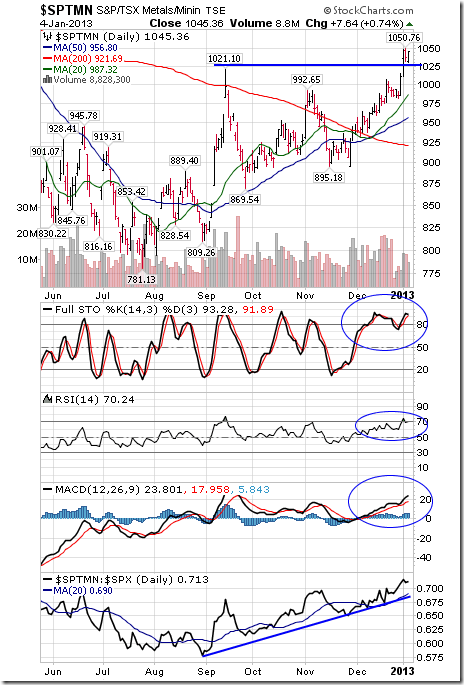
The S&P/TSX Metals & Mining Index added 58.16 points (5.89%) last week. Intermediate uptrend was confirmed on a break above resistance at 1,021.10. The Index remains above its 20, 50 and 200 day moving averages. Short term momentum indicators are overbought, but have yet to show signs of peaking. Strength relative to the S&P 500 Index remains positive.
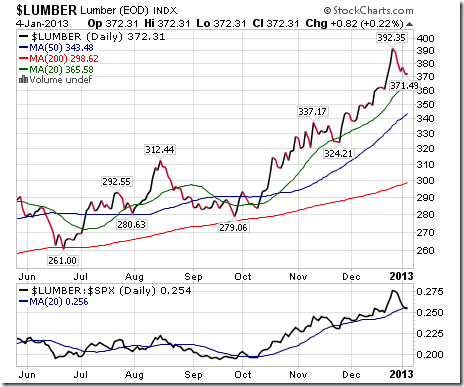
Lumber fell $8.81 (2.31%) last week. Intermediate trend is up. Lumber remains above its 20, 50 and 200 day moving averages. Strength relative to the S&P 500 Index remains positive, but showing early signs of change.
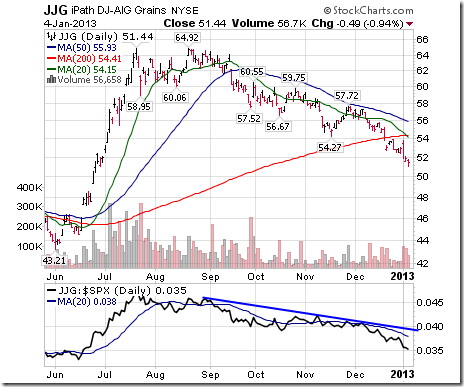
The Grain ETN fell $1.49 (2.82%) last week. Intermediate trend is down. Units remain below their 20, 50 and 200 day moving averages. Strength relative to the S&P 500 remains negative.
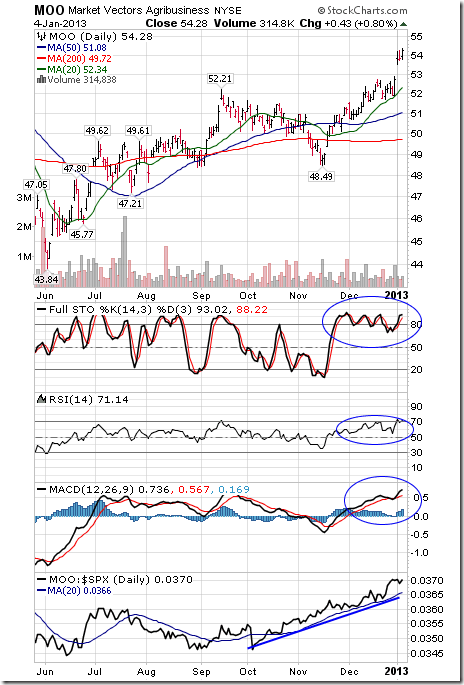
The Agriculture ETF gained $2.32 (4.46%) last week. Intermediate trend is up. Units remain above their 20, 50 and 200 day moving averages. Short term momentum indicators are overbought, but have yet to show signs of peaking. Strength relative to the S&P 500 Index remains positive.
Interest Rates
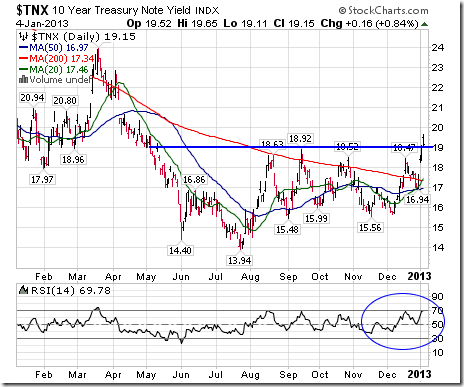
The yield on 10 year Treasuries jumped 20.4 basis points (11.92%) last week. Intermediate trend changed from neutral to up on a break above 1.892%. Short term momentum indicators are overbought, but have yet to show signs of peaking.
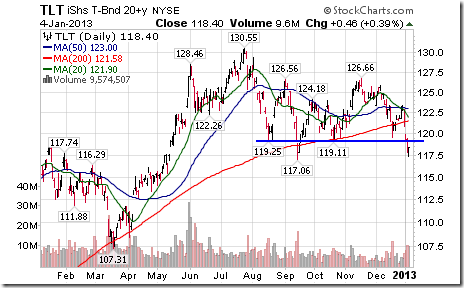
Conversely, price of the long term Treasury ETF fell $4.91 (3.98%) last week and broke support at $119.11.
Other Issues
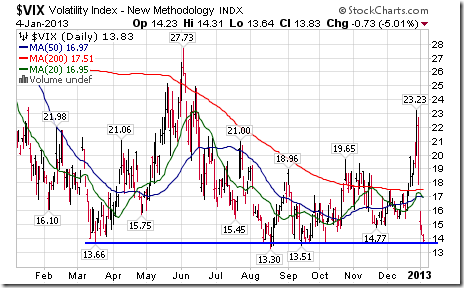
The VIX Index plunged 8.89 points (39.13%) last week following resolution of the “Fiscal Cliff”. Intermediate trend changed from up to neutral on a break below support at 14.77. The Index is testing long term support near 13.50.
Passing of the Fiscal Cliff issue reduced a major uncertainty in equity markets and equity prices responded accordingly. Political issues impacting equity markets likely will calm down between now and Inauguration Day. Thereafter, major issues including tax reform, the end of sequestration and the debt ceiling raise their “ugly heads”. The Fiscal Cliff resolved some of the easy political issues. Now, the hard part of political compromise begins and it will not be pretty.
Fourth quarter earnings reports start to become a focus this week. Reports start to trickle in. Consensus is an increase on a year-over-year basis of 6.0% for S&P 500 companies and a 3.0% increase for the Dow Jones Industrial Average companies. CEOs of major companies like to give good news to shareholders when they release fourth quarter and annual results (share splits, share buy backs, etc.) as well as an encouraging outlook for the following year. However, given the current state of political instability in the U.S., outlook comments may be less favourable this year. Traders will watch closely to reactions to these reports.
Beyond the political crisis during the next three months, equity market prospects are much more attractive assuming a reasonable political settlement is reached. Corporation on both sides of the border continue to hold large cash positions and are waiting for political stability before making major commitment to capital spending.
An added positive factor for equity markets beyond the first quarter of 2013 is news from the Federal Reserve that $85 billion asset purchases by the Fed may end before the end of 2013. The news quickly pressured Treasury prices and raised the likelihood that long term Treasury prices have passed their peak. A downtrend in bond prices as the year progresses will prompt investors to switch from bonds to equities. Following is a link to a report released on www.cnbc.com over the weekend entitled, “Why Goldman thinks you should dump bonds now”. http://www.cnbc.com/id/100355153
History shows that the weakest three month period for U.S. equity market is the three month period in the year after a U.S. president is elected. This the period when the President tries to implement the most difficult programs promised prior to the election. History is repeating.
Technical analysts are warning about a possible significant correction in the first quarter. Following is a link to a comment released late Thursday by Mary Ann Bartels, Merrill Lynch’s technical analyst: http://www.cnbc.com/id/100353125
Economic reports this will have limited impact on the market.
Short and medium term technical indicators for most equity market and sector indices show that prices currently are intermediate overbought, but have yet to show signs of peaking.
Santa Claus was generous this year to investors who held during the December 15th to January 6th classic Santa Claus rally period. However, Santa Claus exited the scene on Friday.
Sectors with positive seasonality at this time of year continue to outperform the S&P 500 Index and the TSX Composite Index including Agriculture, Forest Product equities, Industrials, Semiconductors, Biotech, Europe, Copper and Base Metals. However, most of these sectors reach a short term peak in the first half of January. Sector rotation became apparent late last week when new sectors such as energy began to show outperformance for the first time in months.
The Bottom Line
The “hoped for” short term stock market spurt triggered by a favourable resolution of the Fiscal Cliff has provided an opportunity to take profits on strength on a wide variety of seasonal trades (e.g. agriculture, technology, semiconductors, biotech) and to rotate into other sectors that have a history of outperformance during the January to April period (e.g. energy, platinum, copper).
Thackray’s 2013 Investment Guide
Thackray’s 2013 Investor’s Guide is here. Order through www.alphamountain.com , Amazon, Chapters or Books on Business.
Special Free Services available through www.equityclock.com
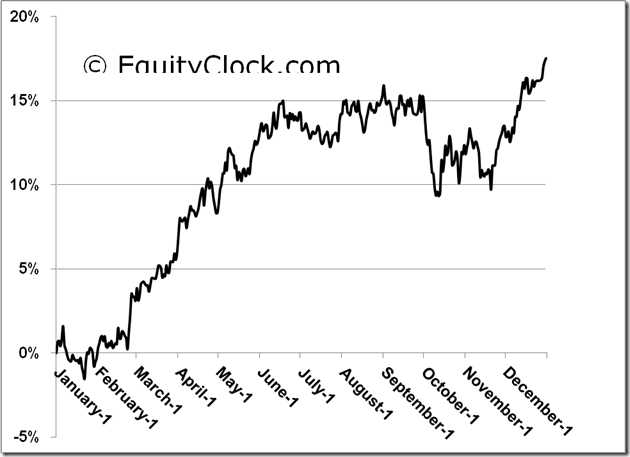
Equityclock.com is offering free access to a data base showing seasonal studies on individual stocks and sectors. The data base holds seasonality studies on over 1000 big and moderate cap securities and indices.
To login, simply go to http://www.equityclock.com/charts/
Following is an example:
Ten year seasonality study on the TSX Energy Index
ETF Column published at www.globeandmail.com
Headline reads, “Silver’s sweet spot for seasonal buying has arrived”. Following is a link to the comment:
Editor’s Note: Interesting reversal in silver on Friday. After opening sharply lower with strength in the U.S.Dollar and weakness in gold, silver recorded an important reversal at the end of the day. Short term momentum indicators are overbought and showing early signs of recovery from an oversold level.
FP Trading Desk Headline
FP Trading Desk headline reads, “Wall Street is incredibly bearish right now and that’s a good thing”. Following is a link to the report:
http://business.financialpost.com/2013/01/03/wall-street-is-incredibly-bearish-right-now-and-thats-a-good-thing/
Disclaimer: Comments and opinions offered in this report at www.timingthemarket.ca are for information only. They should not be considered as advice to purchase or to sell mentioned securities. Data offered in this report is believed to be accurate, but is not guaranteed.
Don and Jon Vialoux are research analysts for Horizons Investment Management Inc. All of the views expressed herein are the personal views of the authors and are not necessarily the views of Horizons Investment Management Inc., although any of the recommendations found herein may be reflected in positions or transactions in the various client portfolios managed by Horizons Investment Management Inc
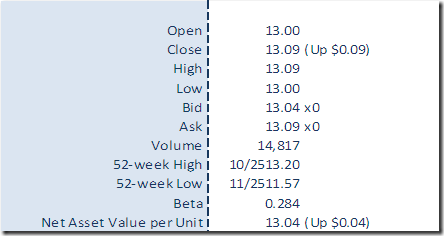
Horizons Seasonal Rotation ETF HAC January 4th 2013


