


In 1981 David Stockman, the Director of the Office of Management and Budget for newly elected President Ronald Reagan, published a budget using such an optimistic set of assumptions that it was derisively nicknamed Rosy Scenario. In Stockman’s 1986 book, The Triumph of Politics, he explained in vivid detail his disillusionment with the politics that thwarted the spending reforms that were supposed to accompany Reagan’s tax cuts. He also expressed his fear for the county’s future, given the explosion in deficits and accumulation of debt. While dreading the consequences of the deficits and debt of the 1980s seems quaint from today’s perspective, and memories of the Reagan era are fading into history, Rosy Scenario lives on.
Too many of today’s fiscal projections extrapolate past growth trends without adjusting for the dramatic deterioration in our future growth outlook. The 2.5% long-term potential growth assumptions for the U.S. economy held out by the White House and Congressional Budget Office are wildly optimistic; indeed, the White House forecast centers on 4% real growth during the proposed recovery years of 2014–2017. While we wouldn’t challenge the idea that such growth is possible, even the White House concedes that these are aggressive assumptions. Rosy Scenario indeed.
The Rosy forecasts are far too tightly anchored to past growth rates, during a demographic “sweet spot” for the developed world. They ignore the headwinds that have been central to our research in the past few years—the “3-D Hurricane” of deficits, debt, and demography. Specifically, the challenges to a Rosy Scenario arise in three core areas: population growth, employment rate growth, and productivity.
Population Growth
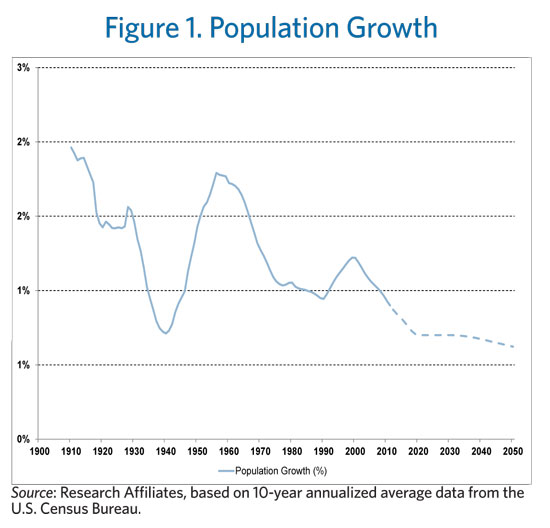
Our population growth has slowed and will continue to slow. Data from the U.S. Census Bureau shows that the annual growth of the U.S. population declined from an average of 1.8% in the 1950s to 1.0% by the 1970s and then down to 0.9% in recent years. This waning growth of our population should not be a surprise; population growth rates have already dropped to zero or less in Japan and much of Europe. The Census Bureau (Ortman and Guarneri, 2009) projects in their low immigration scenario that our population growth rate will decline to 0.8% in the next two decades.
Even these census projections do not take account of the possible demographic impact of the worst economic environment since the Great Depression. We don’t yet know the full effect of the Great Recession on our population growth, but the experience of the 1930s is instructive. During the first two decades of the 20th century, the U.S. population grew by an average of 1.5% per year. Then, population growth dropped by more than half to only 0.7% per year during the 1930s.
We have strong evidence that a similar drop in population growth is occurring now. The household formation rate has plummeted and with it the fertility rate. The Centers for Disease Control reports: “The 2011 preliminary number of U.S. births was 3,953,593, 1% less (or 45,793 fewer) births than in 2010; the general fertility rate (63.2 per 1,000 women age 15–44 years) declined to the lowest rate ever reported for the United States.”
Immigration has also plummeted. The Pew Hispanic Center states: “From 1995 through 2000, we estimate that 3 million Mexicans moved to the United States, and nearly 700,000, including family members born in the United States, went home. From 2005 through 2010, we estimate that about 1.4 million Mexicans arrived, and the same number, including U.S.-born children, left. Considering everything, a return to the migration levels of the late 1990s now seems inconceivable.” Given these declines in both fertility and immigration, forecasts for annual population growth of 0.8% seem optimistic for the next two decades (see Figure 1).
Employment Rate
During the second half of the 20th century, the proportion of our population over age 16 who were employed rose from 56% to 64%. As shown in Figure 2, more than all of this growth is attributable to the rise of the female employment rate from 32% in 1950 to 58% by 2000. The male employment rate declined steadily from 82% in 1950 to 72% in 2000.
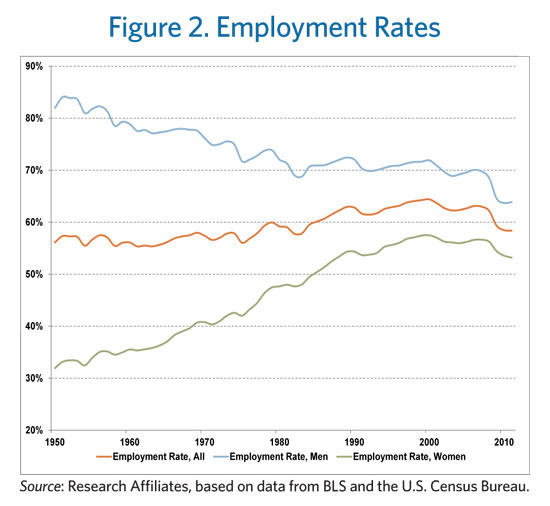
The female employment rate crested in 2000, and the male rate has continued its long gradual decline. The total employment rate declined from its peak of 64% in 2000 to 58% in 2010. Some of this decline is attributable to the recession; some to policy changes that reduce incentives to work (Mulligan, 2012); and some to our aging, a trend that will undoubtedly continue. It bears noting that the effect of demography on employment is an issue on which a libertarian investment manager can agree with neo-Keynesian economist: Paul Krugman (2012) explains this same effect on his blog.
When baby boomers began to work in the 1970s, the proportion of the population over age 55 was less than 18%. Over the past decade, during which the leading edge of the boomers reached age 55, the proportion of the population aged over 55 has risen to 25% (see Figure 3). That may not sound like a big change, but it’s a 19% jump in just half a generation. Those of us over age 55 will rise to 31% of the population by 2030, a 48% jump in 30 years, and will continue to grow thereafter.1

To state the obvious, we can’t see a large jump in the share of the population over 55, without a corresponding drop in the roster under 55. The average employment rate for people aged 25–54 from 1990 through 2010 was 82%; in sharp contrast, the average employment rate for people over age 55 was only 29%. A fast rising proportion of the population in an age group with a low employment rate will lower the total employment rate. While boomers may have to remain employed at rates higher than today’s oldsters, many will choose to retire and others will no longer be able to work.
The rise in the employment rate from 56% in 1950 to 64% in 2000 boosted GDP growth by 0.3% per year relative to a constant employment rate. From 2000 through 2010, the employment rate declined to 58%, enough to shave 1% per year off of GDP, relative to a constant employment rate. Matters have not improved since 2010. While the recession accelerated this decline, demography will continue to exert downward pressure on the U.S. employment rate. A simple calculation, assuming constant employment rates by demographic sub-group, suggests a 0.2% per year continued demographic reduction in GDP growth over the next two decades as boomers move into their retirement years.
The best data for assembling these forecasts comes from the U.S. Census Bureau and the Bureau of Labor Statistics. The Census Bureau provides future population growth rate estimates. Near-term, these are highly reliable. Next year’s 65-year-olds are alive today, age 64; we can count them. The census forecasts do not become blurry, as to the scale of the working age population, until well past 2030. Only the very distant forecasts should be viewed as speculative.
The future path for the total U.S. employment rate can then be calculated with some precision using the detailed demographic data readily available from the Bureau of Labor Statistics (though surprisingly few bother to do so). Any careful examination of the data will confirm our conclusions regarding a slowing rate of population growth and a declining trend in the total employment rate.
Productivity
The third component of GDP growth, productivity, is more difficult to predict.
Here again demography provides some strong clues. Arnott and Chaves (2012) explain that “For each of us, the biggest jump in our contribution to GDP occurs as we transition from nonworking adolescents into gainfully employed 20-somethings. Another, often smaller, jump in our contribution to GDP occurs as we mature into our 30s. By our 40s, the evidence of real wages would suggest that most of us are at or approaching our peak contribution to GDP, with a falling contribution to GDP in our 50s and 60s.” It’s not that mature adults are unproductive; rather, once we reach peak productivity (outside of unskilled labor, this appears to happen in our 40s and 50s), our productivity crests; our contribution to GDP growth turns negative. The aging of the baby boom generation over the next two decades will depress the U.S. employment rate, and the aging of the labor force will slow our productivity growth.
The unavoidable fiscal contraction required to address our unsustainable budget deficit also dampens the outlook for productivity growth. The U.S. government deficit, as officially measured, has grown to nearly 10% of GDP; if the government were to rely on generally accepted accounting principles (GAAP), our deficit has averaged 10% of GDP for a generation. Debt as officially reported has grown to over 100% of GDP. But, again, this figure soars when we add in state and local government debt and government sponsored enterprises (FNMA and FHLMC). The debt level is truly horrific if we count the present value of entitlement commitments (see Figure 4).

Borrowing to invest can raise our future productivity growth, but only if the return on capital exceeds the cost of debt. Unfortunately, we did not borrow to invest; we borrowed to consume. Debt-financed consumption did not just raise employment. It inflated our measure of output per person. As the global financial crisis so convincingly demonstrated, much of our recent GDP growth was unsustainable, debt-financed consumption. For this reason, reported GDP over recent decades overstates both our true prosperity and our true growth.2 If GDP more properly measured production instead of consumption, then measured productivity growth would have been significantly lower. Reducing consumption to a level that may be sustained by domestic production requires sharply lower growth in real GDP per capita, until we are no longer spending beyond our means (see Arnott, 2011a).
Considering both the aging of our population and the required fiscal contraction, we estimate productivity growth of 0.5% per year for the next several decades. This forecast may strike many as overly pessimistic. But before dismissing our estimate, consider the 2012 writing of Robert J. Gordon of Northwestern University, perhaps the world’s foremost expert on productivity growth. Professor Gordon says: “Even if innovation were to continue into the future at the rate of the two decades before 2007, the U.S. faces six headwinds that are in the process of dragging long-term growth to half or less of the 1.9% annual rate experienced between 1860 and 2007. These include demography, education, inequality, globalization, energy/environment, and the overhang of consumer and government debt. A provocative ‘exercise in subtraction’ suggests that future growth in consumption per capita for the bottom 99 percent of the income distribution could fall below 0.5% per year for an extended period of decades.” We would include the top 1% in Dr. Gordon’s assessment; slow growth will not spare the affluent.
1% Growth Rate
For the 50 years from 1951 through 2000, U.S. GDP growth averaged 3.3% per year.3 We can attribute this historical growth to three primary components: 1.4% from population growth, 0.3% from a rising employment rate, and 1.6% from growth of output per person employed (productivity). In the coming 20 years, all three components of growth will be much lower.
Births and fertility rates are declining. Immigration has slowed to a trickle in response to harsh immigration policies and a dimmed growth outlook. For the next two decades, the U.S. population will grow by only 0.7% per year, half the rate of growth witnessed in the late 20th century.
The total employment rate will continue to decline as boomers move from their 50s into their 60s and 70s. Whereas a rising employment rate added 0.3% per year to GDP growth from 1950 through 2000, the demographic effect on the employment ratio will subtract 0.2% for the next two decades. The population will be growing by 0.7% per year, but the employable work force will be growing by only about 0.5% per year.
Productivity growth faces severe headwinds from both demography and fiscal contraction. If the productivity growth of our aging labor force is 0.5%, then future GDP growth will be centered around 1%.
Demography guarantees a sharp slowdown in GDP growth. 1% real growth is still growth. It’s a joy to behold, if our expectations are anchored on zero, as was the case throughout human history before the industrial revolution. But, if our expectations are tied to the 3% growth from 1950 to 2000, the 1% growth seems abysmal.
Slower growth is not a serious problem; it’s the expectations gap that poses economic and political dangers in the years ahead.
Demography is Destiny?
Demography is destiny. But, while it is the most immutable force shaping our future, it is not the only force that matters.
This 1% “new normal” for GDP growth is, of course, subject to considerable uncertainty. Our policy choices will have a dramatic influence on all three drivers of economic growth. Immigration reform, while politically difficult, could help slow the decline in population growth. We can increase the rate of employment by revising our transfer payment policies to provide ample incentives for employers to employ and for the labor force to seek employment. We can boost productivity by changing our tax policy to encourage savings and investment, rather than printing money to support debt-financed consumption.
It seems unlikely that we can reverse the decline in fertility rates observed across the developed world.4 Immigration can, however, move the needle on U.S. population growth by several tenths of a percentage point per year. The United States absorbed one million immigrants per year in the past when our total population was much smaller than today. The positive contributions of immigration to growth are well documented, as summarized by Professor Gordon Hanson (2012) at UC San Diego. While the economics are uncontroversial, the politics are not promising. Both the right and the left have their own separate reasons to resist changing our immigration policies.
The structure of our tax and transfer payment systems has a significant influence on employment rates. Our combination of regressive payroll taxes and phase-out of transfer payments results in effective marginal tax rates above 40%—in some cases far above 40%—for the working poor (Kotlikoff and Rapson, 2006), while we tax carried interest in private equity deals at only 15%. As the authors observe: “The patterns by age and income of marginal net tax rates on earnings, marginal net tax rates on saving, and tax-arbitrage opportunities can be summarized with one word—bizarre.” Reform of our tax and transfer payment systems, to reward work instead of penalizing it, could add as many as 30 million jobs in a few short years (Arnott, 2011b).
The most important determinant of our productivity per person is the amount of capital we have available for investment, and wise use of that capital. Investing to improve productivity in all of its forms, from machine tools, to transportation infrastructure, to education, can all raise our productivity. Investing requires savings and we have been saving far too little. To increase productivity requires that we reorient our economy away from debt-financed consumption and toward saving-financed investment.
In this context, ending the mortgage interest deduction seems oddly absent from our political debate, perhaps because it would run counter to long-standing bipartisan policies promoting the American dream of home ownership and perhaps because it would simply be too unpopular. Nonetheless, the tax deductibility of interest on home mortgages (which was effectively reaffirmed when the Tax Reform Act of 1986 rescinded the deductibility of credit card interest) has been credibly identified as one of the factors that eventuated in the financial crisis (Szegö, 2011). Because borrowing against one’s house is inexpensive on an after-tax basis, it was easy to rationalize converting the wealth effect of rising prices from a psychological phenomenon to actual cash on hand for consumer spending. Banks and families are still paying for the good times, and the overhang of properties in foreclosure ensures that the residential real estate market will not fully recover for years to come. Yet there is little discussion of changing the tax code with regard to debt collateralized by borrowers’ homes.
Unless we change our policies to encourage immigration, employment, and investment, our new normal growth rate will be 1%. Government tax and spending plans, based upon the Rosy Scenario of extrapolating past growth rates, are likely to exacerbate our already unsustainable deficits and dangerous accumulation of debt.
Endnotes
1. See Current Estimates Data, Population Estimates, United States Census Bureau: http://www.census.gov/popest/data/
2. We think our reliance on GDP aggravates and encourages our current problems. GDP measures consumption. So, we think we’re gaining ground when we increase consumption, even if that consumption is funded by deficit spending or by increases in personal debt. See Arnott (2011a).
3. U.S. Department of Commerce: Bureau of Economic Analysis.
4. For each the G-7, fertility rates fell below replacement levels between 1965 and 1975. Among the BRIC’s, only India still has a fertility rate above replacement levels, and that rate is falling very fast. Fertility rates that are below replacement rates eventually lead to a population of zero (as John Calhoun’s rats demonstrated in the 1960s). But we’ll leave this puzzle for future generations to solve.
References
Arnott, Robert D. 2011a. “Does Unreal GDP Drive our Policy Choices?” Fundamentals (April).
———. 2011b. “30 Million New Jobs in 5 Years? Yes We Can!” Real Clear Markets (October 12).
Arnott, Robert D., and Denis B. Chaves. 2012. “Demographic Changes, Financial Markets, and the Economy,” Financial Analysts Journal, vol. 68, no. 1 (January/February):23–46.
Gordon, Robert J. 2012. “Is U.S. Economic Growth Over? Faltering Innovation Confronts the Six Headwinds,” NBER Working Paper No. 18315 (August): http://www.nber.org/papers/w18315.
Hanson, Gordon H. 2012. “Immigration and Economic Growth,” Cato Journal, vol. 32, no. 1 (Winter):25–34.
Kotlikoff, Laurence, and David Rapson. 2006. “Does it Pay, at the Margin, to Work and Save?—Measuring Effective Marginal Taxes on Americans’ Labor Supply and Saving,” NBER Working Paper 12533 (December).
Krugman, Paul. 2012. “Constant-Demography Employment (Wonkish but Relevant), The New York Times (October 6).
Mulligan, Casey B. 2012. “Do Welfare Policies Matter for Labor Market Aggregates? Quantifying Safety Net Work Incentives Since 2007,” University of Chicago Working Paper (January).
Ortman, Jennifer M., and Christine E. Guarneri. 2009. “United States Population Projections: 2000 to 2050,” United States Census Bureau.
Szegö, Giorgio. 2011. “Causes of the Economic Crisis: Can the Flap of a Butterfly Wing in Brazil Destroy the Coliseum…After 30 Years?” Journal of Risk Management in Financial Institutions, vol. 4, no. 3 (June):216–228.
Copyright © Research Affiliates


