by Don Vialoux, TechTalk
Upcoming US Events for Today:
- The Chicago Fed National Activity Index for October will be released at 8:30am. The market expects 0.18 versus 0.0 previous.
- The Dallas Fed Manufacturing Survey for November will be released at 10:30am. The market expects 4.7 versus 1.8 previous.
Upcoming International Events for Today:
- Italian Consumer Confidence for November will be released at 4:00am EST. The market expects 86.4, consistent with the previous report.
- Euro-Zone Finance Ministers to Meet on Greek Debt at 6:30am EST.
The Markets
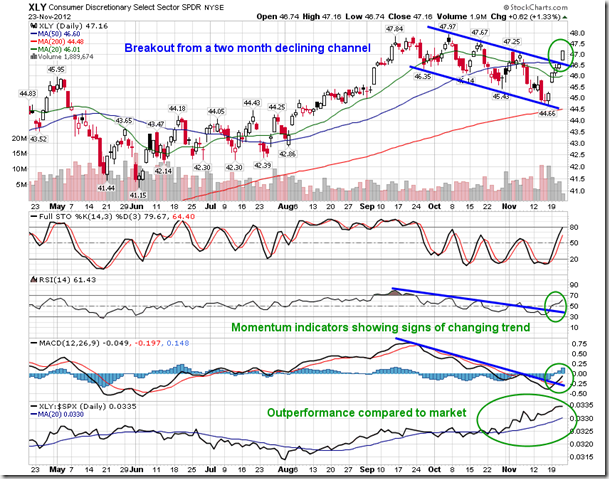
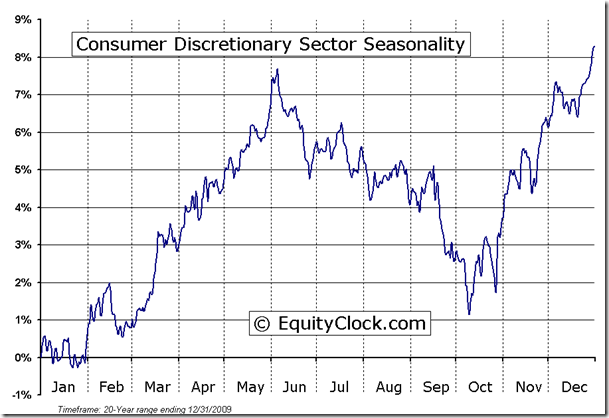
Stocks jumped on Friday to finish off the holiday shortened Thanksgiving week in the US. Volumes were low, but spirits were high as optimism that a solution to the fiscal cliff will be achieved and busy holiday shopping malls on Black Friday gave lift to cyclically sensitive stocks, particularly Consumer Discretionary. The sector ETF (XLY) is trading above all significant moving averages (20, 50, and 200-day) and performance relative to the market remains positive. News over the weekend that Black Friday shopping has hit a new record should further support the performance of the sector. CNNMoney.com reports that “Total spending over the four-day weekend reached a record $59.1 billion, a 13% increase from $52.4 billion last year, according to the NRF.” Consumer sentiment appears unscathed by the problems in Europe and the potential risks of going over the fiscal cliff, which provides optimism that fourth quarter economic stats could be quite strong in the US despite the ongoing concerns. The Consumer Discretionary sector remains seasonally strong through to May.
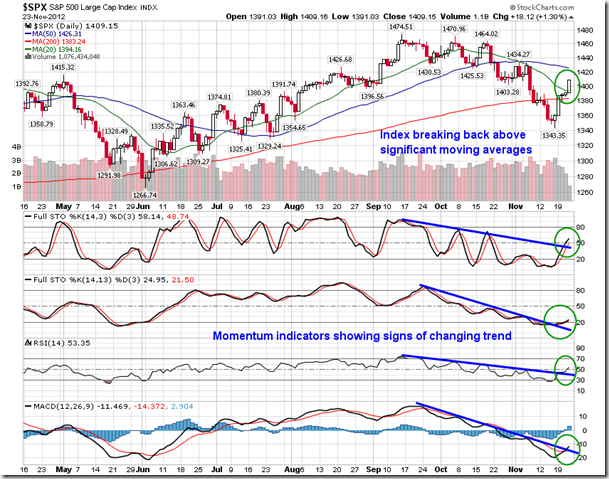
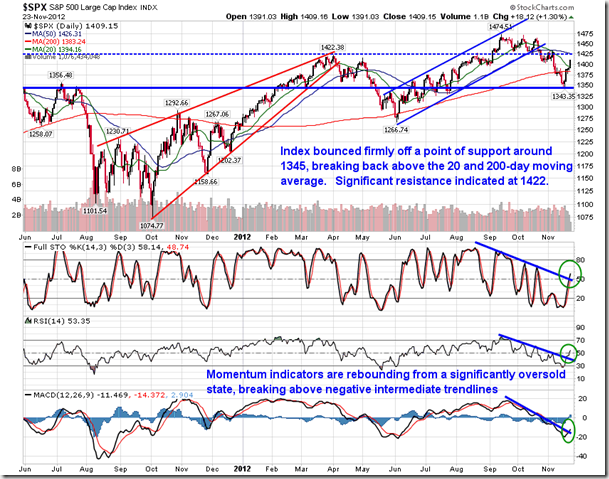
Turning to the technicals of the market, the price action of last week charted some rather significant short-term patterns. The S&P 500 broke firmly above its 20-day moving average, suggesting short-term strength. Momentum indicators are rebounding from significantly oversold levels, triggering buy signals for a positive move that could persist into next month. Momentum indicators had been trending lower since the middle of September, but last week the trend showed signs of change as the downward sloping trendlines were broken in a positive move. RSI has crossed above 50 and MACD has crossed above its signal line, providing some of the first broad market “buy” signals since the period of seasonal strength for equities began in October. Key resistance exists at 1422, also approximately matching the 50-day moving average, which continues to show signs of curling lower. A break above this critical level could see stocks run towards the highs of the year and beyond.
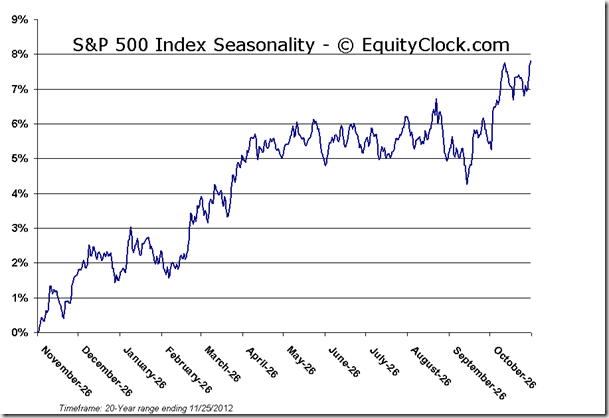
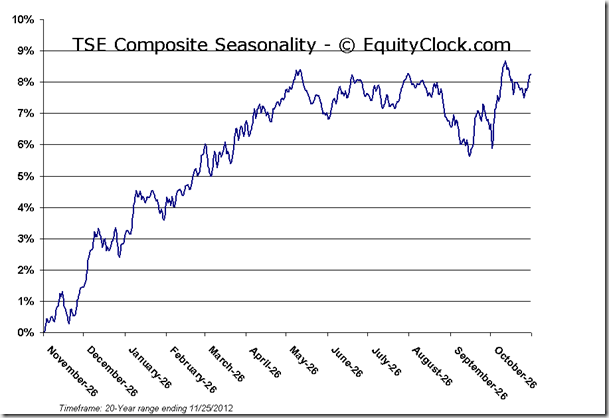
The seasonal backdrop remains promising for a continuation of the rally that began last week. Of course we have been widely reporting that positive tendencies for equities exist during the Thanksgiving holiday week. The strongly positive tendency has yet to come to an end. The positive holiday trade leads into a strong month-end period when portfolio reallocations and fund inflows benefit stocks into the first few days of December. Average gain for the S&P 500 index between November 20th and December 6th reaches a lucrative 2.2%. Then of course the last two weeks in December investors realize positive returns as the Santa Claus rally lifts stocks prior to the end of the year. Assuming concerns pertaining to the fiscal cliff don’t deter from the positive seasonal bias, stocks could be setup to move strongly higher over the next five weeks of trading left in the year.
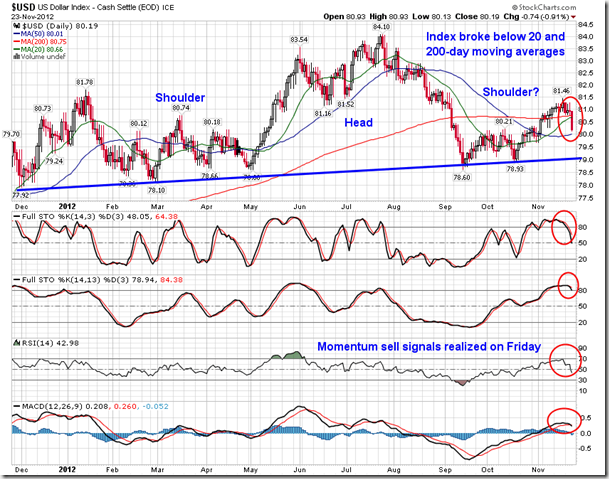
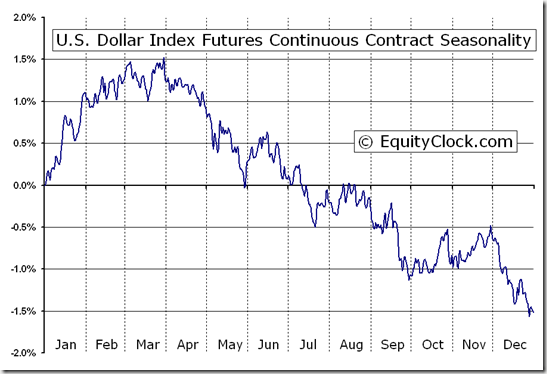
One of the catalysts for a positive move in risk assets into year-end could be a decline in the US Dollar. We’ve been reporting for a couple of months that the US Dollar index typically trades flat to positive in October and November, resuming a seasonal downtrend into the month of December. Strength over the past eight weeks in the currency index has certainly held true to seasonal norms, but signs of change are becoming evident. On Friday, the US Dollar index broke firmly below its 20 and 200-day moving average. Momentum sell signals have also become apparent. A break below the 50-day moving average around 80 could see the index test significant support around 78.60, a level that if broken could see stocks and commodities explode higher. A significant head-and shoulders pattern may also be coming into play with the neckline of the bearish setup around the aforementioned key support. Until 78.60 is broken, only support can be derived, leaving the bearish US dollar potential as mere speculation. The US Dollar index typically trades sharply lower in December before kicking off a positive trend during the first quarter of the new year.
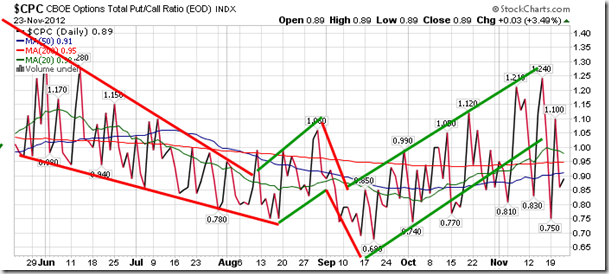
Sentiment on Friday, as gauged by the put-call ratio, ended bullish at 0.89. The ratio has been swinging wildly between bullish and bearish territory over the past couple of weeks, hinting of a possible trend change from that of pessimism to optimism as investors let loose of their grasp of protective put options.
Chart Courtesy of StockCharts.com
Chart Courtesy of StockCharts.com
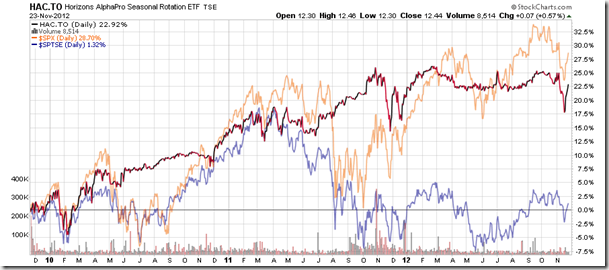
Horizons Seasonal Rotation ETF (TSX:HAC)
- Closing Market Value: $12.44 (up 0.57%)
- Closing NAV/Unit: $12.51 (up 1.51%)
Performance*
| 2012 Year-to-Date | Since Inception (Nov 19, 2009) | |
| HAC.TO | 2.74% | 25.1% |
* performance calculated on Closing NAV/Unit as provided by custodian
Click Here to learn more about the proprietary, seasonal rotation investment strategy developed by research analysts Don Vialoux, Brooke Thackray, and Jon Vialoux.
Copyright © TechTalk


