by Don Vialoux, TechTalk, EquityClock.com
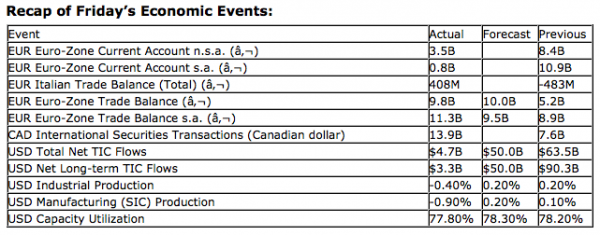
Upcoming US Events for Today:
- Existing Home Sales for October will be released at 10:00am. The market expects 4.7M versus 4.75M previous.
- The NAHB Housing Market Index for November will be released at 10:00am EST. The market expects 42 versus 41 previous.
Upcoming International Events for Today:
- The Bank of Japan Rate Decision will be released. The market expects no change at 0.1%.
The Markets
Markets reversed earlier losses and ended positive on Friday, buoyed by optimism surrounding a solution to the fiscal cliff. Congressional and senate leaders met with the president on Friday and comments released following the meeting were fairly encouraging. The leaders are going to establish a set of milestones to achieve in order to have a solution in place before Christmas. Leaders are even expected to work through the Thanksgiving holiday week and meet again with the president at the beginning of next week. Stocks ended close to the highs of the day, capping off a dismal week for equity markets that saw most major benchmarks end with losses between 1% to 2%.
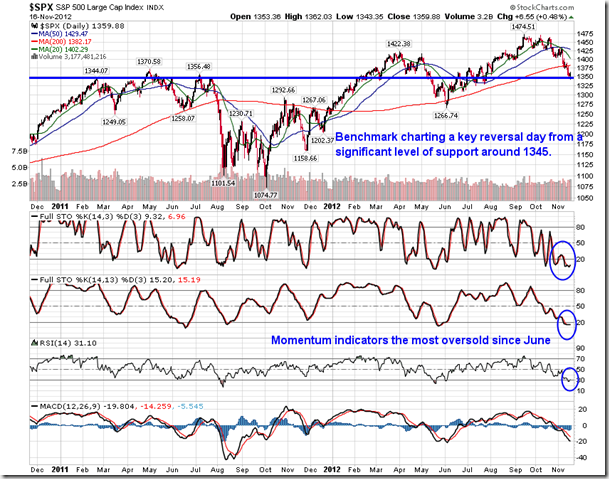
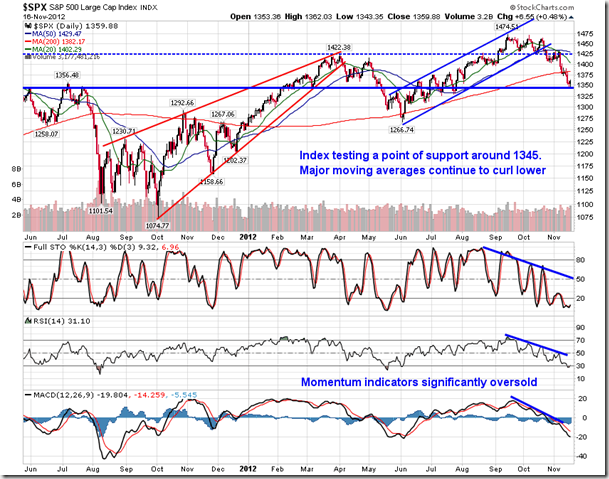
The reversal on Friday came at a fairly critical point for the S&P 500. We have remained focused on possible support at 1345 on the large cap index, representing a point of consolidation over the past couple of years. The level also approximately represents a 61.8% retracement, a key Fibonacci level, of the June through September rally. The S&P 500 reached a low of 1343 on Friday, rebounding higher by around 19 points during the session, charting a reversal candlestick on the day. Evidence is starting to grow that a bounce may be upon us. Momentum indicators had become the most oversold since the June low, suggesting that the market had moved too far, too fast to the downside. The question is, will Friday’s reversal become the start of just a short-term bounce or the continuation of the intermediate trend? Since the June lows have not been broken, it would be premature to suggest the conclusion of the intermediate trend, which continues to show a series of higher-highs and higher-lows. The short-term trend is, obviously, negative. The 200-day moving average, which was broken just last week, could prove to resist any positive price action. The same too could be said of the 20-day moving average, which has already resisted a rebound attempt at the beginning of November. A break above 1425 would provide reason to believe the positive intermediate-term trend remains intact and that higher-highs are ahead of us. Friday’s lows, around 1343, now become support, a level which if broken could easily see a quick retest back to the June low.
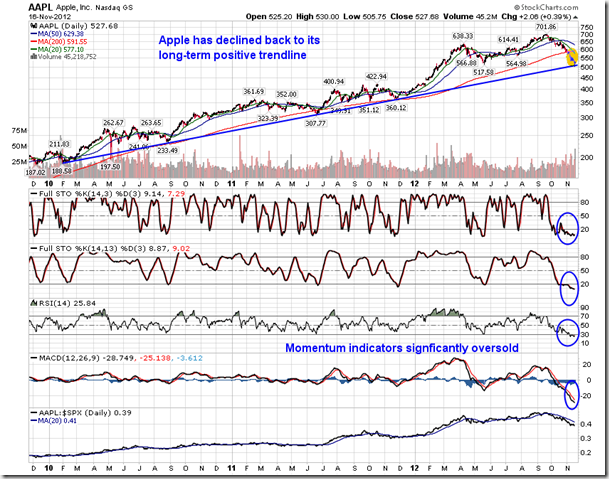
Aside from key reversal patterns that were realized in broad market benchmarks, Apple also saw a significant reversal session, losing around $20 earlier in the session and rebounding into positive territory by the close. Apple has been an underperformer since the September high and a significant influence on the negative price action of major equity benchmarks. Strength in this stock would significantly assist equity market strength, particularly since seasonal tendencies for the market at this time of year are affected by consumer and technology stocks leading into the holiday period. Aside from positive seasonal influences impacting the stock, there is reason to believe the stock will bounce higher from around present levels. The stock has declined back to is long-term rising trendline, correcting the near parabolic price action realized in the first quarter of the year. The stock is also the most oversold since 2008, suggesting that the negative momentum is unsustainable. Significant moving averages surround the $600 price level, suggesting that this may be a logical point to test upon any short-term positive momentum.
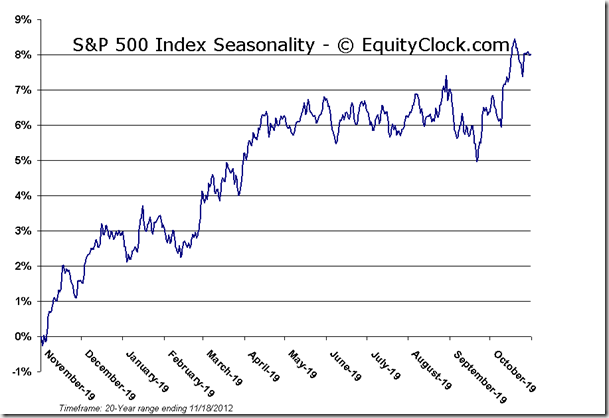
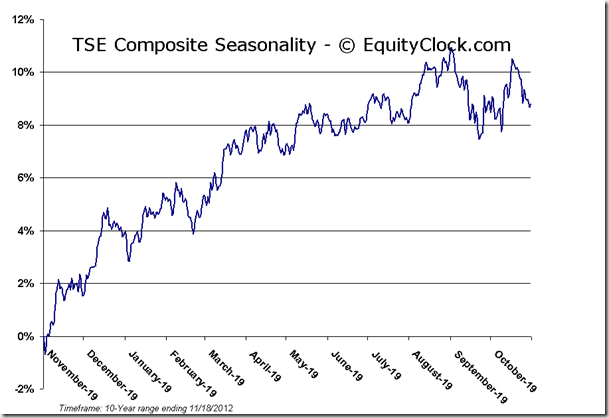
Thanksgiving in the US is this Thursday and a quiet week is typically the result. Markets drift around on lower than average volumes as significant market moving news is kept to a minimum and traders take some time off. As a result, the bias is to the upside. Traders are unwilling to place or hold onto significant negative bets over the holiday period and a jovial atmosphere (or perhaps a tryptophan induced coma) exists amongst the trading floors, sending stocks higher. Since 1980, the S&P 500 index has gained an average of 0.55% during the holiday week, positive 59.4% of the periods. The day prior and the day following Thanksgiving are the two most profitable days of the week with an average return of 0.27% typical on Wednesday and 0.18% the average for Friday. Wednesday has been profitable 72% of the time, while Friday has been profitable 63% of the time, since 1980.
Market tendencies remain strongly positive into December. The S&P 500 has shown average gains of 2.2% between November 20th to December 6th. A profitable holiday period leads into a positive month-end, implying that the weeks ahead present a very interesting opportunity to hold risk assets, both from a seasonal perspective and a technical one; fundamentals remain the risk. Markets are very oversold according to a number of indicators and a bounce is well overdue. A retracement of the recent losses during a seasonally favourable timeframe when fundamental news flow is typically slow is very probable.
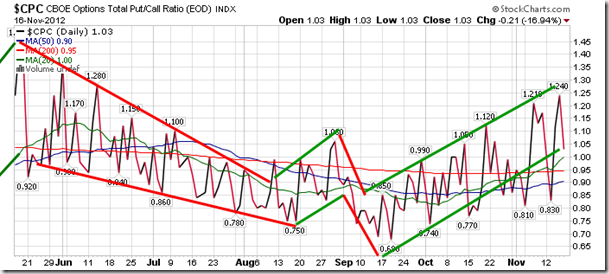
Sentiment on Friday, according to the put-call ratio, ended close to neutral at 1.03. The put-call ratio hit an overly bearish high of 1.24 on Thursday, implying extreme investor pessimism, typically a contrarian indicator to buy equities.
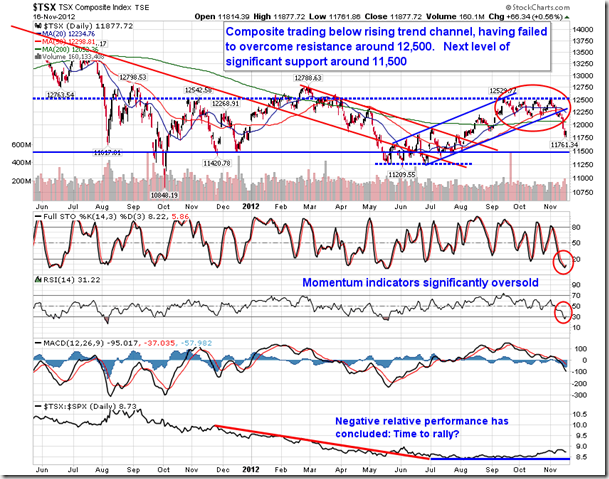
Chart Courtesy of StockCharts.com
Chart Courtesy of StockCharts.com
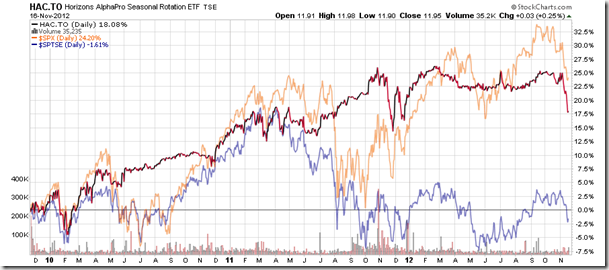
Horizons Seasonal Rotation ETF (TSX:HAC)
- Closing Market Value: $11.95 (up 0.25%)
- Closing NAV/Unit: $12.02 (up 0.34%)
Performance*
| 2012 Year-to-Date | Since Inception (Nov 19, 2009) | |
| HAC.TO | -1.30% | 20.2% |
* performance calculated on Closing NAV/Unit as provided by custodian
Click Here to learn more about the proprietary, seasonal rotation investment strategy developed by research analysts Don Vialoux, Brooke Thackray, and Jon Vialoux.
Copyright © TechTalk, EquityClock.com


