by SIA Charts
In this week's edition of the SIA Equity Leaders Weekly we are going to take a look at the comparison between equal weighting vs. cap weighting on the US and Canadian major indexes. A comparison between the S&P Equal Weight (RSP) vs. the S&P 500 ETF (IVV) is showing a relative out-performer while the Canadian TSX 60 Equal Wight (HEW.TO) vs. the TSX 60 (XIU.TO) is showing more indecision.
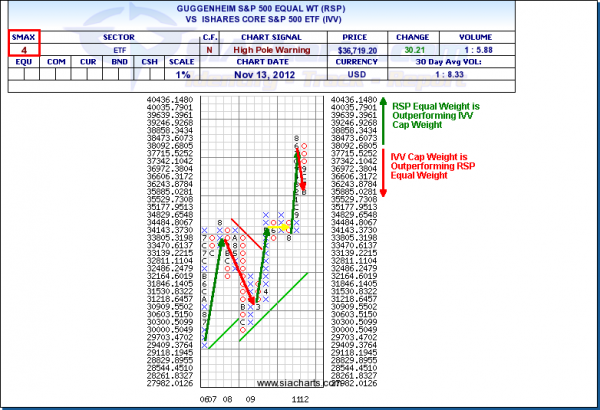
Guggenheim S&P 500 Equal Weight vs. iShares Core S&P 500 ETF (RSP vs. IVV)
Since June of 2006, the equal weighting of the S&P 500 (RSP) has been the relative out-performer for the long run. But, there have been two periods during this time where the cap weighted version of the S&P 500 has shown some strength. You can see on the first chart below, that the Cap Weighted S&P 500 ETF (IVV) has had two main periods of out-performance in 2008 and most recently the end of 2011 continuing into this year.
So while the long-term trend has favored the Equal Weight, the Cap Weight is seeing more strength in the near-term. Usually, if the equal weight is winning this comparison, this has been a bullish signal for the markets. Inversely, the current situation is showing cap weight winning this comparison and more bearish for the markets with out-performance coming from fewer names. We continue to monitor this relationship to see if this relationship changes or if the current trend strengthens.
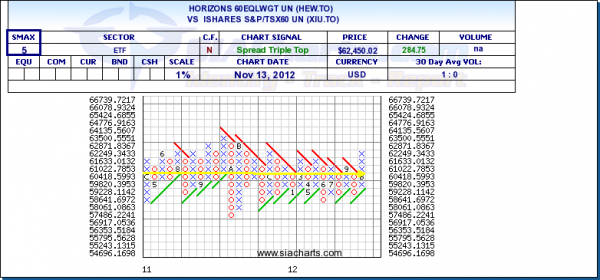
Horizons Equal Weight TSX 60 vs. iShares S&P/TSX 60 (HEW.TO vs. XIU.TO)
Unlike the US comparison, the Canadian Large Cap comparison between the Equal Weight (HEW.TO) and the Cap Weight (XIU.TO) has shown relative indifference and nothing material. Since this comparison only goes back two years (since HEW.TO was first launched in Oct of 2010), we don't have the same history to reference. But, from the chart to the right, there is no material relative preference towards either weighting. Again, it is important to monitor these charts to see if the relationship changes and a weighting starts winning the battle possibly signaling market turns.
Important Disclaimer
SIACharts.com specifically represents that it does not give investment advice or advocate the purchase or sale of any security or investment. None of the information contained in this website or document constitutes an offer to sell or the solicitation of an offer to buy any security or other investment or an offer to provide investment services of any kind. Neither SIACharts.com (FundCharts Inc.) nor its third party content providers shall be liable for any errors, inaccuracies or delays in content, or for any actions taken in reliance thereon.
Copyright © siacharts.com


