by Don Vialoux, TechTalk
Upcoming US Events for Today:
1. The Treasury Budget for October will be released at 2:00pm EST.
Upcoming International Events for Today:
1. European Finance Ministers meet in Brussels.
2. Great Britain Consumer Price Index for October will be released at 4:30am EST. The market expects a year-over-year increase of 2.4% versus 2.2% previous.
3. German Economic Sentiment for November will be released at 5:00am EST. The market expects –11.5, consistent with the previous report.
The Markets
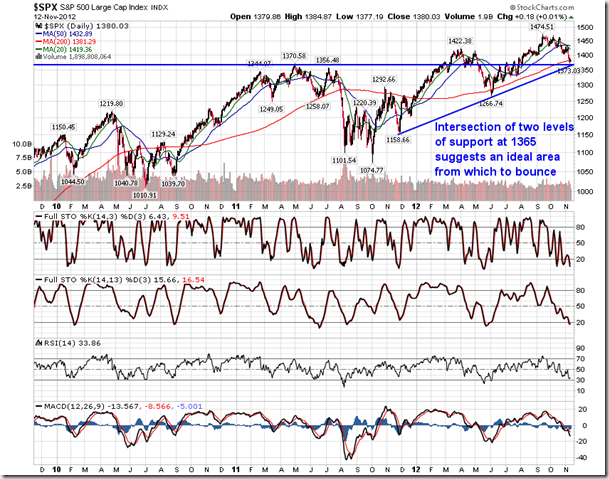
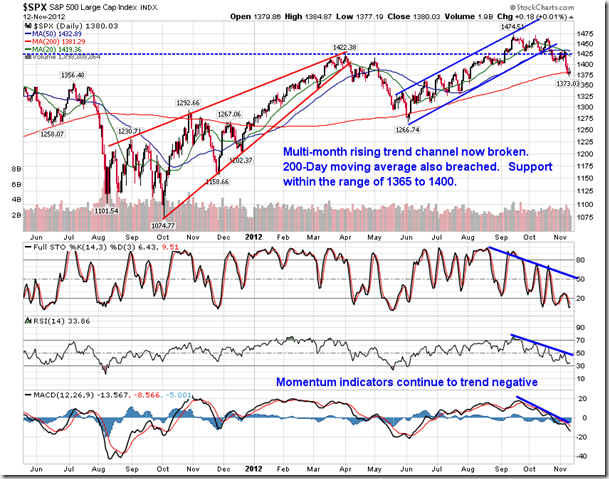
Markets ended essentially unchanged on Monday as traders recognized Veteran’s Day in the US and Remembrance Day in Canada. Bond markets were closed and equity volumes were light. Turing to the S&P 500 Index, the short-term trend remains negative, defined by lower-lows and lower-highs. Momentum indicators continue to trend lower in a similar fashion, suggesting no lessening to the selling pressures. Major moving averages, such as the 20 and 50-day, continue to show signs of rolling over, being dragged along by the equity market price action which has yet to show any sign of significant support. The S&P 500 is sitting on the 200-day moving average as of Monday’s close; both the Dow Jones Industrial Average and NASDAQ Composite have already broken definitively below this significant average. Resistance continues to be apparent at the 20 and 50-day. One of the final levels of support before equity market technicals begin to suggest something more detrimental than just a “pullback” is 1365. The level marks the convergence of two levels of support, one rising off of last November’s lows and the other marking a horizontal line connecting the 2011 highs to the winter 2012 lows. Equity markets are currently the most oversold since June, just prior to the summer rally. It is inevitable that equities will bounce somewhere in here, but the extent (whether of not the bounce forms into a trend) has yet to be determined. Dependency on a solution to the fiscal cliff will no doubt play a factor in how sustainable any bounce will be.
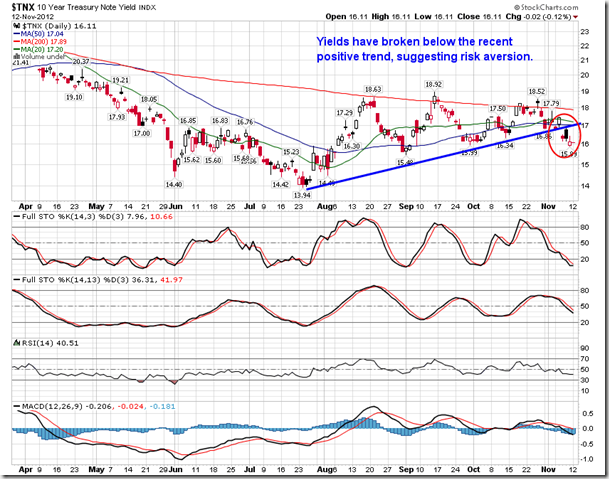
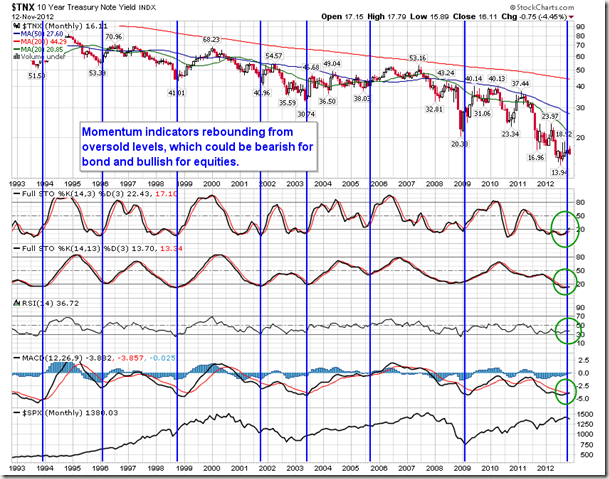
As equity markets have weakened, bond prices have strengthened, pushing yields back toward historic lows charted this past summer. Looking at the 10-year treasury note, the rising trendline off of the summer lows has been broken, suggesting risk aversion as investors flee back into the safe-haven asset class. This negative pattern is expected to persist as long as investors have concerns pertaining to equities. However, the long-term pattern, as derived by the monthly chart, is starting to look interesting. It is obvious that bond yields are severely stretched to the downside, becoming the most oversold since 2009, despite equity markets moving higher over the past few years. Momentum indicators are already starting to show early signs of rebounding from oversold levels in an attempt to correct a severely oversold state. Over the past twenty years, as momentum indicators produce bullish signals, such as what is presently being realized, yields move higher and so to do equity prices. Typically during the early stages of rising borrowing costs the urgency grows for investors to take advantage of low rates. This urgency creates a simulative effect on the economy as investment capital flows. Investments will be realized in housing, businesses, and stocks. Obviously the Fed has committed to keep rates low for an extended period, potentially limiting the economic investment stimulus immediately. However, the positive effect is typically realized in stocks well before the Fed acts to raise rates, and should investors come to the realization that the multi-decade bull-run in bonds is over, assets could likely flow out of bonds and into other investments.
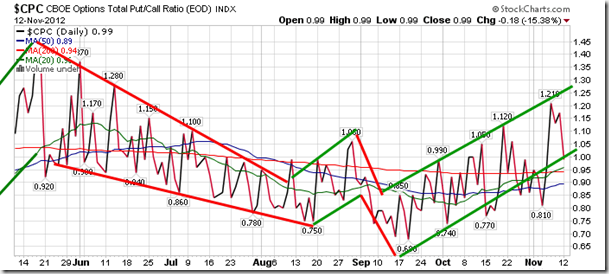
Sentiment on Monday, as gauged by the put-call ratio, ended around neutral at 0.99. The ratio continues to trend positive, which suggests an increasing amount of fear in the market, a characteristic of a bearish equity market trend.
Chart Courtesy of StockCharts.com
Chart Courtesy of StockCharts.com
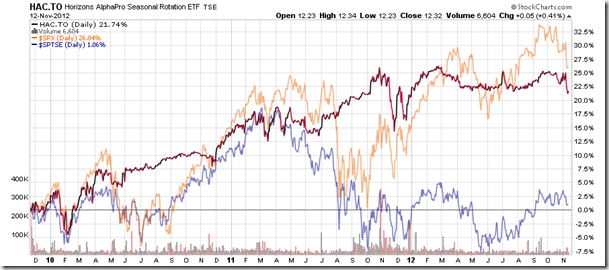
Horizons Seasonal Rotation ETF (TSX:HAC)
- Closing Market Value: $12.32 (up 0.41%)
- Closing NAV/Unit: $12.29 (up 0.10%)
Performance*
| 2012 Year-to-Date | Since Inception (Nov 19, 2009) | |
| HAC.TO | 0.90% | 22.9% |
* performance calculated on Closing NAV/Unit as provided by custodian
Click Here to learn more about the proprietary, seasonal rotation investment strategy developed by research analysts Don Vialoux, Brooke Thackray, and Jon Vialoux.


