by Don Vialoux, TechTalk
Pre-opening Comments for Monday November 12th
U.S. equity index futures are higher this morning. S&P 500 futures are up 5 points in pre-opening trade. Index futures are responding to overnight strength in European and Chinese equity markets. European equity markets were supported by news that Greece passed its budget required to receive financing from the Troika. Data released by China suggest re-acceleration of economic growth on lower inflation.
Index futures also responded to news that President Obama will meet with Congressional leaders on Friday to discuss resolution of the Fiscal Cliff.
Lower than average volume on North American equity markets is expected today due to bank holidays in the U.S. and Canada.
The Brick has agreed to a takeover by Leon’s Furniture for $5.40 per share in a deal valued at $700 million. The Brick closed on Friday at $3.50 per share. Fairfax Financial owns a 37% interest in The Brick.
Leucadia has agreed to purchase remaining outstanding shares of Jefferies Group for 0.81 shares of Leucadia for each Jefferies share. Leucadia already owns 28.6% of Jefferies.
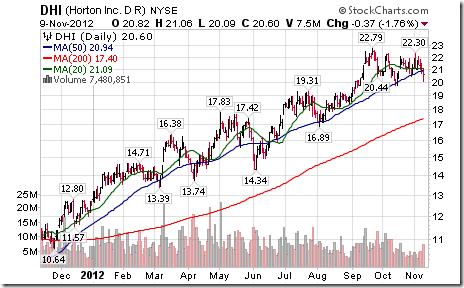
DR Horton added $0.67 to $21.27 after reporting higher than consensus fiscal fourth quarter earnings.
BMO Capital has adjusted recommendations on selected U.S. health care stocks. Merck was upgraded from Market Perform to Outperform with a target price of $50. Bristol Myers Squibb was downgraded from Outperform to Market perform with a target price of $37. Merck added $0.44 to $44.49 and Bristol Myers Squibb eased $0.15 to $32.08.
Caterpillar (CAT $84.94) is expected to open lower after JP Morgan downgraded the stock from Overweight to Neutral.
KLA Tencor (KLAC $46.24) is expected to open higher after RBC Capital upgraded the stock from Under Perform to Outperform.
Disney added $0.69 to $47.75 after Citigroup upgraded the stock from Neutral to Buy with a target price of $54.
Technical Watch
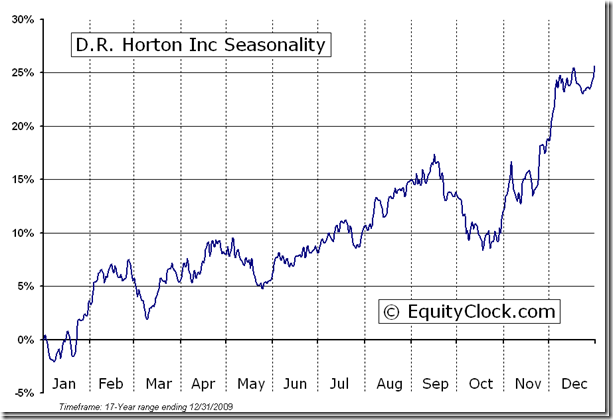
DR Horton Inc. (NYSE:DHI) – $21.27 added 3.3% after reporting higher than consensus fiscal fourth quarter earnings. The stock has a positive technical profile. Intermediate trend is up. The stock trades above its 200 day moving average and is expected to open above its 20 and 50 day moving averages. Short term momentum indicators are neutral. Strength relative to the S&P 500 Index has been positive during the past year. Seasonal influences are strongly positive at this time of the year. Preferred strategy is to accumulate the stock at current or lower prices.
D.R. Horton, Inc. (NYSE:DHI) Seasonal Chart
Economic News
October retail sales to be released at 8:30 AM EST on Wednesday are expected to decline 0.2% versus a gain of 1.1% in September. Ex autos, retail sales are expected to increase 0.1% versus a gain of 1.1% in September.
October Producer Prices to be released at 8:30 AM EST on Wednesday are expected to be unchanged versus a gain of 1.1% in September. Excluding food and energy, PPI is expected to increase 0.1% versus no change in September.
September Inventories to be released at 10:00 AM EST on Wednesday are expected to increase 0.6% versus a gain of 0.6% in August.
FOMC Meeting Minutes for the October 24th meeting are scheduled to be released at 2:00 PM EST on Wednesday.
Weekly Initial Jobless Claims to be released at 8:30 AM EST on Thursday are expected to increase to 388,000 from 355,000 last week.
October Consumer Prices to be released at 8:30 AM EST on Thursday are expected to increase 0.1% versus a gain of 0.6% in September. Excluding food and energy, CPI is expected to increase 0.1% versus a gain of 0.1% in September.
The November Empire Manufacturing Index to be released at 8:30 AM EST on Thursday is expected to fall to -9.3 from -6.2 in October.
The November Philadelphia Fed Index to be released at 10:00 AM EST on Thursday is expected to fall to -1.0 from +5.7 in October.
October Industrial Production to be released at 9:15 AM EST on Friday is expected to be unchanged versus a gain of 0.4% in September. October Capacity Utilization is expected slip to 78.2% from 78.3% in September.
Earnings News This Week
Monday: DR Horton
Tuesday: Cisco, Home Depot, IAMGold, TJX Companies
Wednesday: Loblaw, NetApps, Power Corp., Power Financial, Staples
Thursday: Applied Materials, Gap Stores, Intuit, Sears Holdings, Viacom, Wal-Mart
Equity Trends
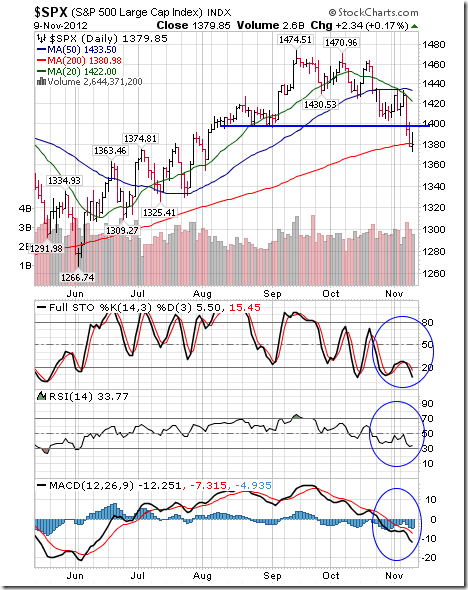
The S&P 500 Index fell 34.35 points (2.43%) last week. Intermediate trend is down. Support at 1,396.56 was broken on Wednesday. The Index remains below its 20 and 50 day moving averages and closed at its 200 day moving average on Friday. Short term momentum indicators are oversold, but have yet to show signs of bottoming.
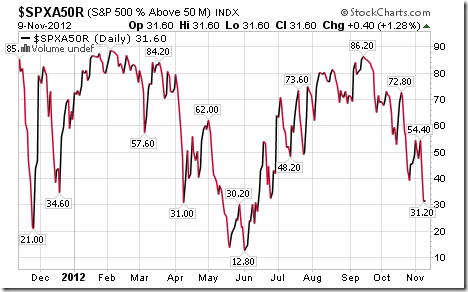
Percent of S&P 500 stocks trading above their 50 day moving average dropped last week to 31.60% from 49.60%. Percent continues an intermediate downtrend.
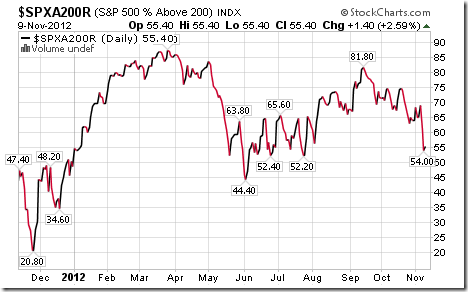
Percent of S&P 500 stocks trading above their 200 day moving average dropped last week to 55.40% from 65.20%. Percent continues an intermediate downtrend.
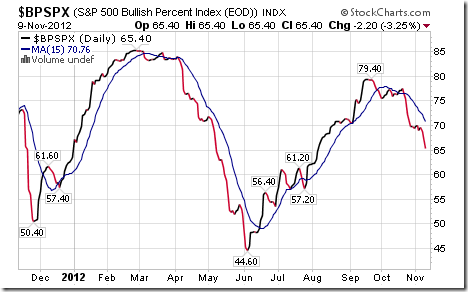
Bullish Percent Index for S&P 500 stocks fell last week to 65.40% from 70.20% and remains below its 15 day moving average. The Index remains in an intermediate downtrend.
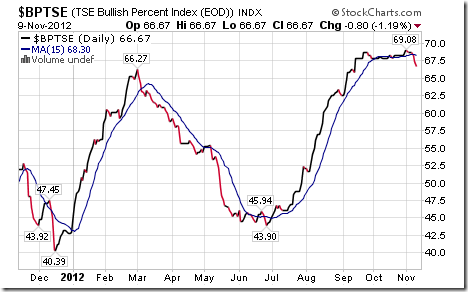
Bullish Percent Index for TSX Composite stocks slipped last week to 66.67% from 68.67% and moved below its 15 day moving average. Percent is intermediate overbought and showing early signs of rolling over.
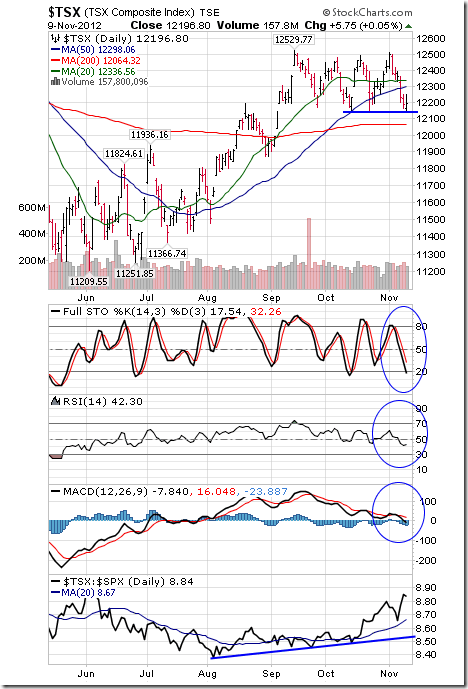
The TSX Composite Index fell 183.61 points (1.48%) last week. Intermediate trend is neutral. Support is at 12,137.18 set on October 15th. Resistance is at 12,529.77. The Index remains above its 200 day moving average and below its 20 and 50 day moving averages. Short term momentum indicators are trending down, but have yet to show signs of bottoming. Strength relative to the S&P 500 Index remains positive.
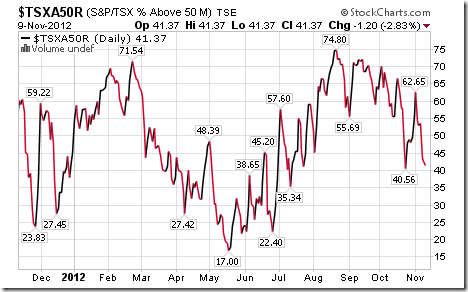
Percent of TSX Composite stocks trading above their 50 day moving average fell last week to 41.37% from 54.22%. Percent is in an intermediate downtrend.
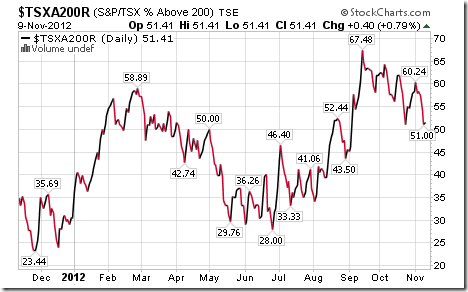
Percent of TSX Composite stocks trading above their 200 day moving average fell last week to 51.41% from 57.83%. Percent is in an intermediate downtrend.
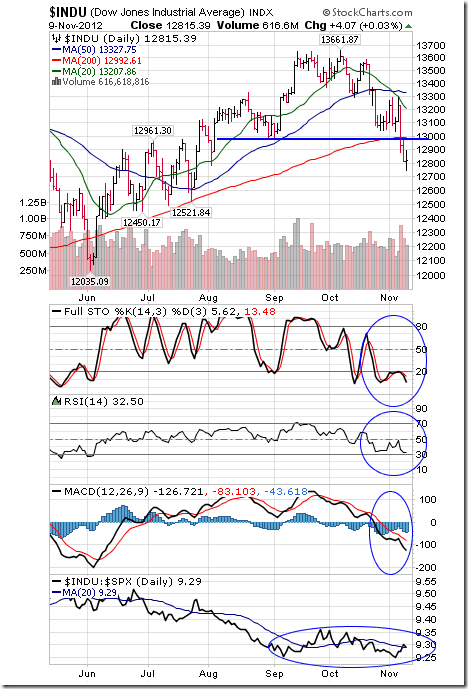
The Dow Jones Industrial Average lost 277.77 points (2.12%) last week. Intermediate trend is down. Support at 12,977.09 was broken on Wednesday. The Average remains below its 20 and 50 day moving averages and fell below its 200 day moving averages. Short term momentum indicators are oversold, but have yet to show signs of bottoming. Strength relative to the S&P 500 Index has been negative, but is showing signs of change.
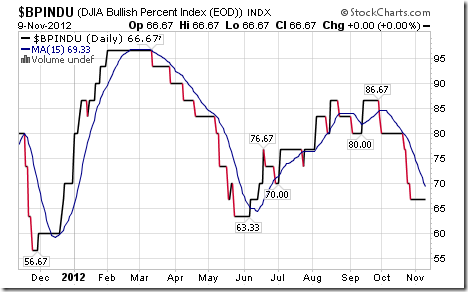
Bullish Percent Index for Dow Jones Industrial Average stocks was unchanged last week at 66.67% and remained below its 15 day moving average. The Index continues to trend down.
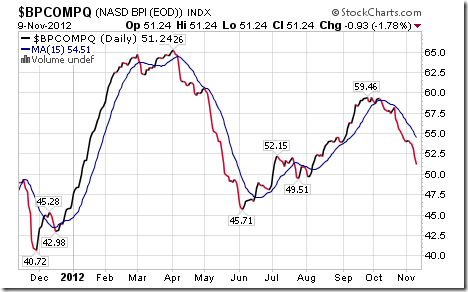
Bullish Percent Index for the NASDAQ Composite Index fell last week to 51.24% from 54.23% and remained below its 15 day moving average. The Index continues to trend down.
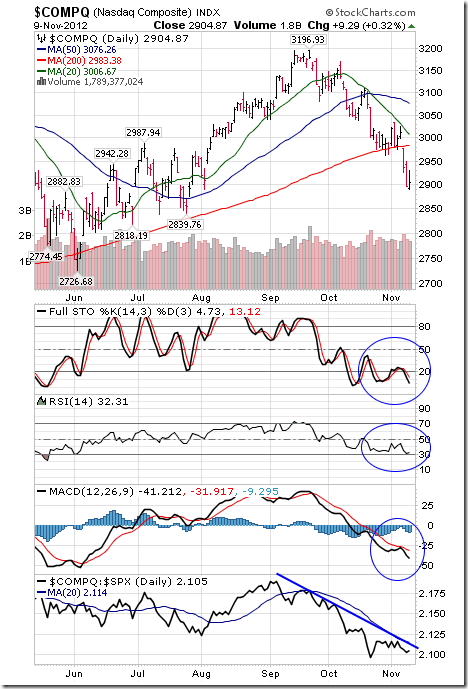
The NASDAQ Composite Index fell 77.26 points (2.59%) last week. Intermediate trend is down. The Index remains below its 20 and 50 day moving averages and fell below its 200 day moving average. Short term momentum indicators are oversold, but have yet to show signs of bottoming. Strength relative to the S&P 500 Index remains negative.
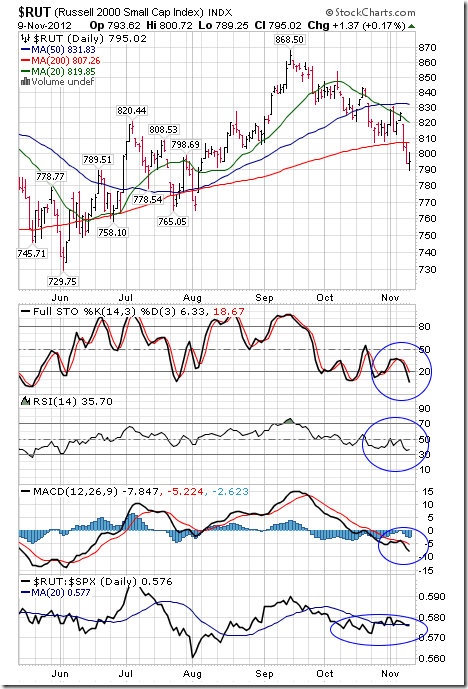
The Russell 2000 Index fell 19.38 points (2.38%) last week. Intermediate trend is down. The Index remains below its 20 and 50 day moving averages and dropped below its 200 day moving average. Short term momentum indicators are oversold, but have yet to show signs of bottoming. Strength relative to the S&P 500 Index is neutral.
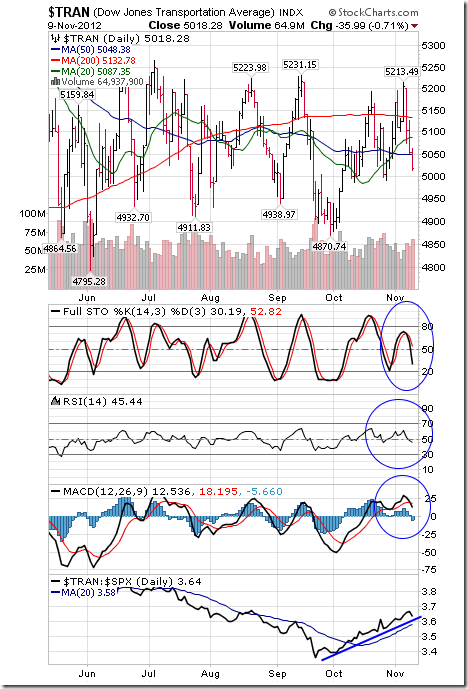
The Dow Jones Transportation Average fell 91.89 points (1.80%) last week. Intermediate trend is up. The Average remained below its 200 day moving averages and moved below its 20 and 50 day moving averages. Short term momentum indicators are trending down. Strength relative to the S&P 500 Index remains positive.
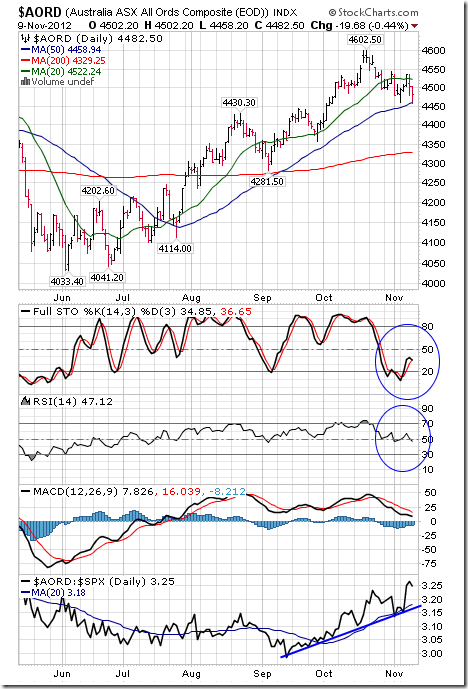
The Australia All Ordinaries Composite Index slipped 0.80 (0.02%) last week. Intermediate trend is up. The Index remains below its 20 day moving average and above its 50 and 200 day moving averages. Short term momentum indicators are neutral. Strength relative to the S&P 500 Index remains positive.
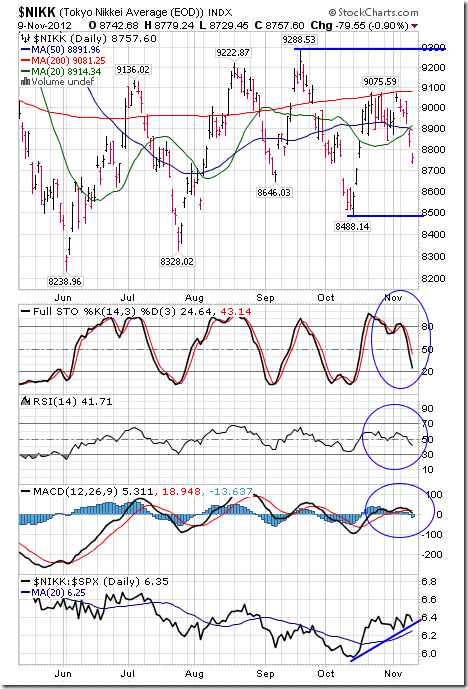
The Nikkei Average fell 293.62 points (3.24%) last week. Intermediate trend is neutral. The Average remains below its 200 day moving average and fell below its 20 and 50 day moving averages. Short term momentum indicators are trending down. Strength relative to the S&P 500 Index remains positive, but showing early signs of change.
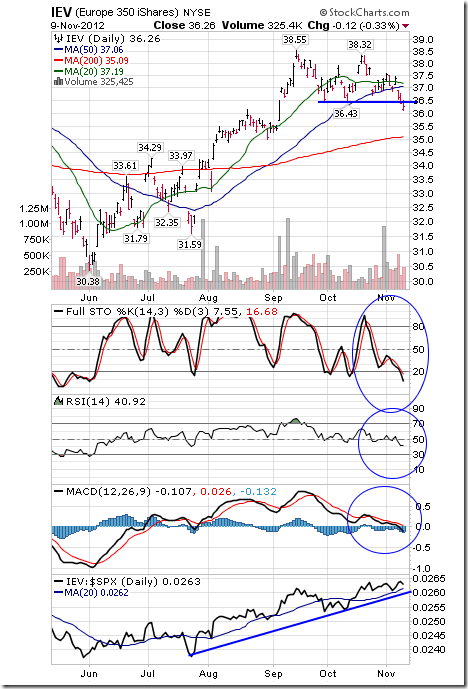
The Europe 350 iShares fell $0.84 (2.26%) last week. Intermediate trend changed from up to down on a break below support at $36.43. The Index trades below its 20 and 50 day moving averages and above its 200 day moving average. Short term momentum indicators are trending down. Strength relative to the S&P 500 Index remains positive.
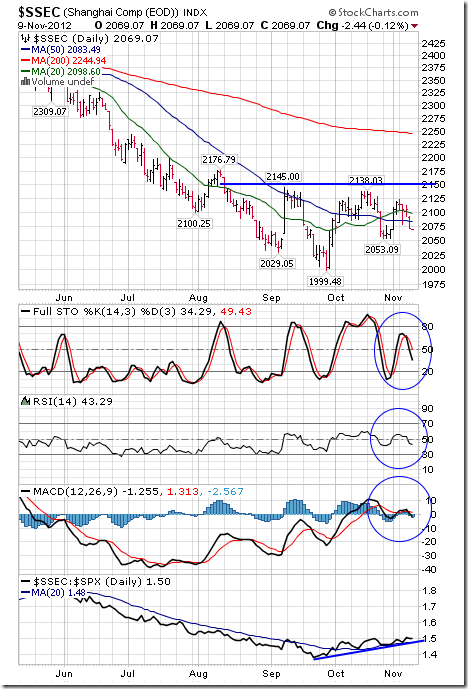
The Shanghai Composite Index dropped 47.98 points (2.27%) last week. Intermediate trend is down. However, a break above 2,145 will complete a reverse head and shoulders pattern. Short term momentum indicators are trending down. The Index remains below its 200 day moving average and fell below its 20 and 50 day moving averages. Strength relative to the S&P 500 Index remains positive. ‘Tis the season for the Index to move higher!
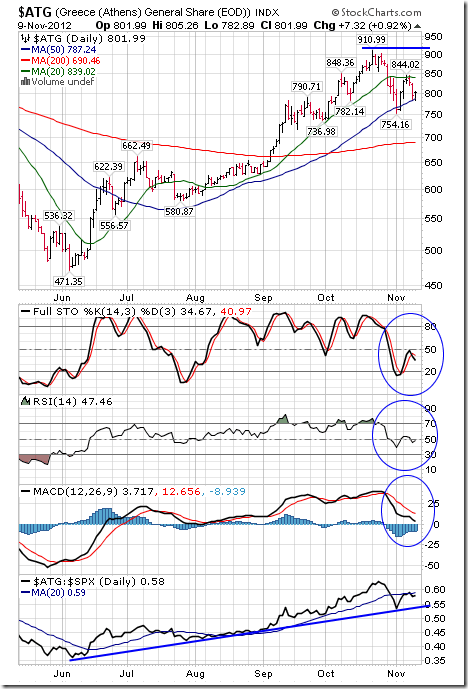
The Athens Index fell 3.22 points (0.40%) last week. Intermediate trend is neutral. The Index remains above its 50 and 200 day moving average and below its 20 day moving average. Short term momentum indicators are neutral. Strength relative to the S&P 500 Index remains positive.
Currencies
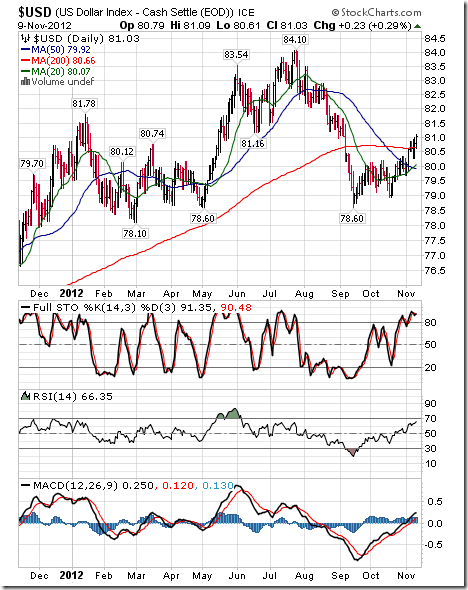
The U.S. Dollar gained 0.44 (0.55%) last week. Intermediate trend is up. The Index remains above its 20 and 50 day moving averages and moved above its 200 day moving average. Short term momentum indicators are overbought, but have yet to show signs of peaking.
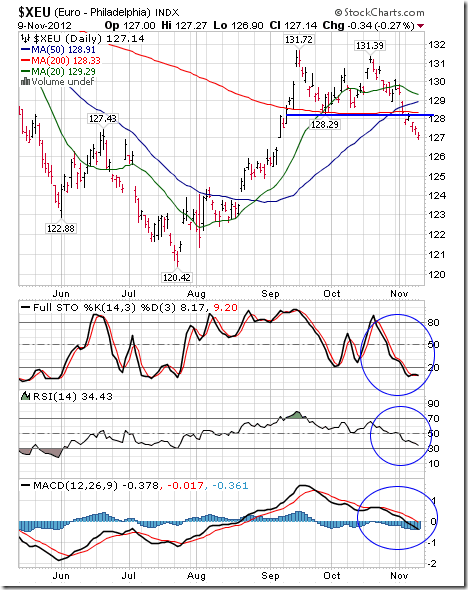
The Euro fell 1.21 (0.94%) last week. Intermediate trend is down. The Index remains below its 20, 50 and 200 day moving averages. Short term momentum indicators are trending down.
The Canadian Dollar slipped 0.49 cents U.S. last week. Intermediate trend is down. The Canuck Buck remains below its 20 and 50 day moving averages and slipped below its 200 day moving average. Short term momentum indicators are oversold, but have yet to show signs of bottoming.
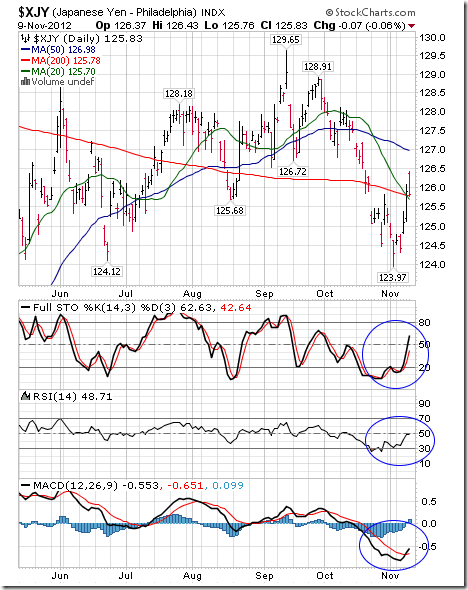
The Japanese Yen added 1.55 (1.25%) last week. Intermediate trend is down. The Yen moved above its 20 and 50 day moving averages. Short term momentum indicators are trending higher.
Commodities
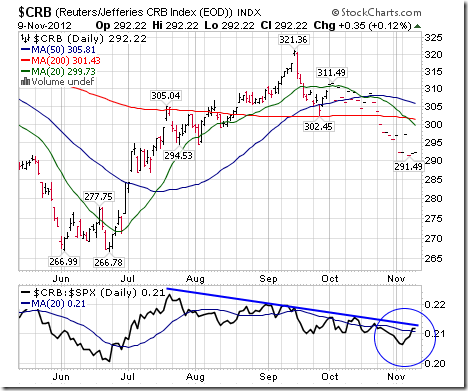
The CRB Index slipped 0.07 (0.02%) last week. Intermediate trend is down. The Index remains below its 20, 50 and 200 day moving averages. Strength relative to the S&P 500 Index is negative, but showing early signs of change.
Gasoline added $0.11 per gallon (4.25%) last week. Gasoline moved above its 20 day moving average on Friday. Strength relative to the S&P 500 Index has been negative, but showing signs of change to at least neutral.
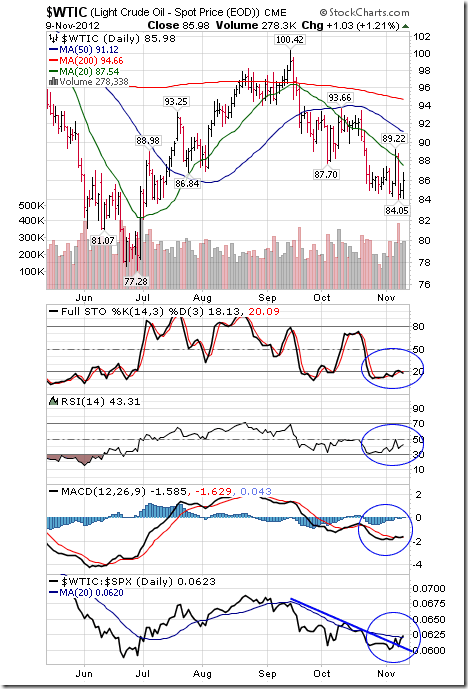
Crude Oil gained $1.12 per barrel (1.32%) last week with most of the gain coming on Friday. Intermediate trend is down. Crude remains below its 20, 50 and 200 day moving averages. Short term momentum indicators are oversold and showing early signs of bottoming. Strength relative to the S&P 500 Index has been negative, but showing signs of improvement to at least negative.
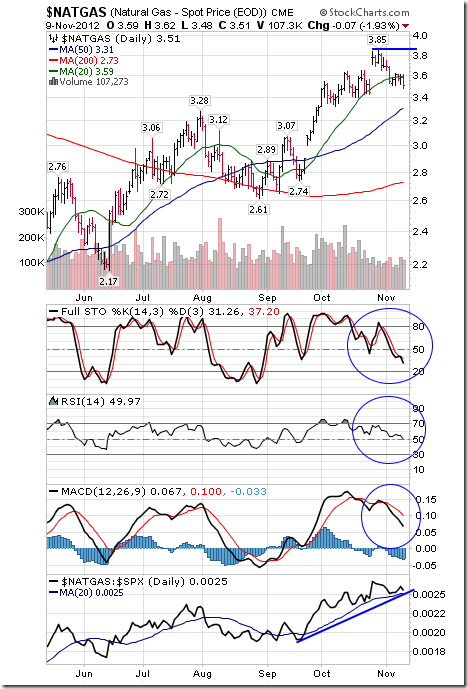
Natural Gas fell slipped $0.04 (1.13%) last week. Intermediate trend is up. Natural gas remains above its 50 and 200 day moving averages and below its 20 day moving averages. Short term momentum indicators are trending down. Strength relative to the S&P 500 Index is positive, but showing signs of change.
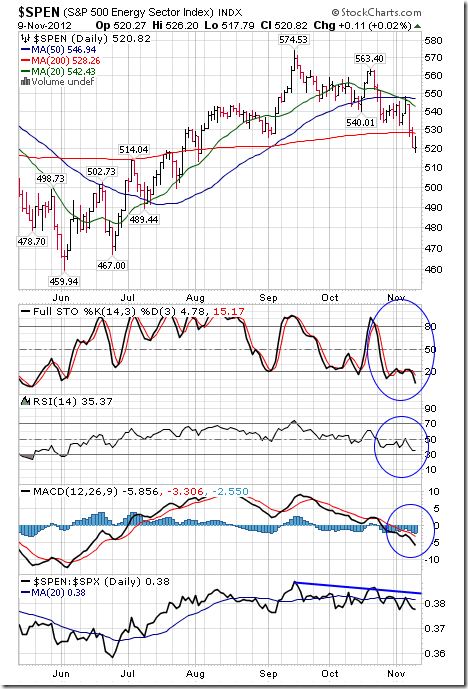
The S&P Energy Index fell 13.05 points (2.44%) last week. The Index remains below its 20 and 50 day moving averages and moved below its 200 day moving average. Short term momentum indicators are oversold, but have yet to show signs of bottoming. Strength relative to the S&P 500 Index remains neutral/mildly negative.
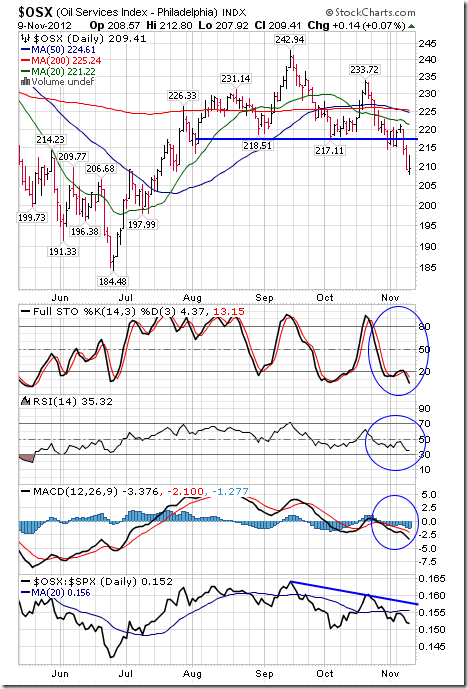
The Philadelphia Oil Services Index fell 6.10 points (2.83%) last week. Intermediate trend is down. The Index remains below its 20, 50 and 200 day moving averages. Short term momentum indicators are oversold, but have yet to show signs of bottoming. Strength relative to the S&P 500 Index remains negative.
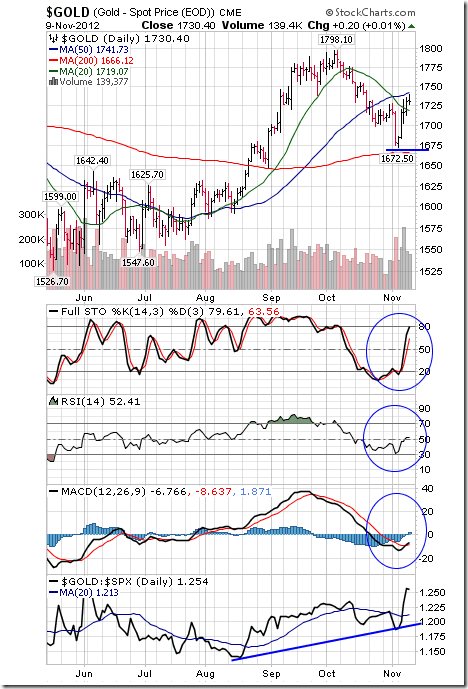
Gold gained $51.60 per ounce (3.07%) last week. Gold bounced from near its 200 day moving average and recently moved above its 20 day moving average. Short term momentum indicators are trending up. Strength relative to the S&P 500 Index has turned positive.
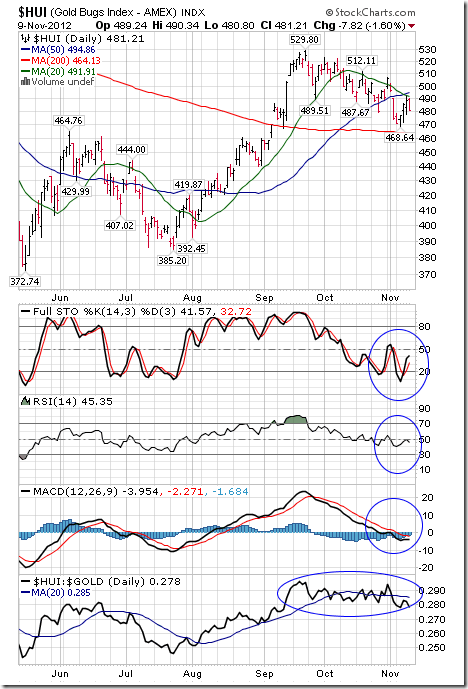
The AMEX Gold Bug Index added 6.65 points (1.40%) last week. Intermediate trend is down. The Index recently bounced from near its 200 day moving averages, but remains below its 20 and 50 day moving averages. Short term momentum indicators are neutral. Strength relative to gold is neutral/slightly negative.
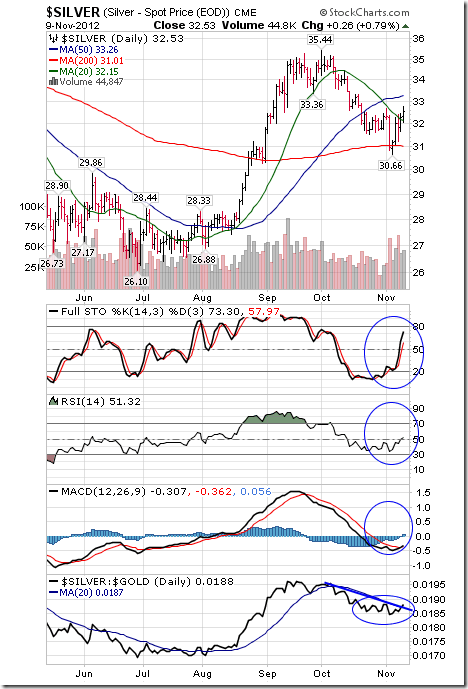
Silver gained $1.56 per ounce (5.04%) last week. Silver bounced from near its 200 day moving average and moved above its 20 day moving average on Friday. Short term momentum indicators are trending up. Strength relative to gold has been negative, but is showing early signs of change.
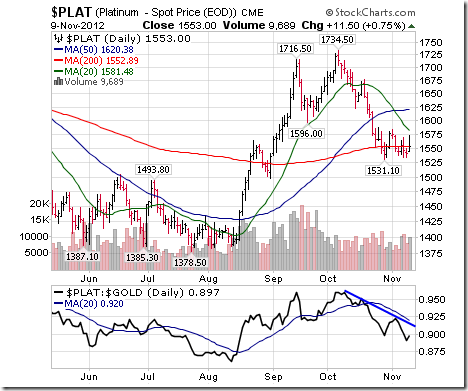
Platinum added $3.40 per ounce (0.22%) last week. Platinum remains below its 20, 50 and 200 day moving averages. Strength relative to gold remains negative.
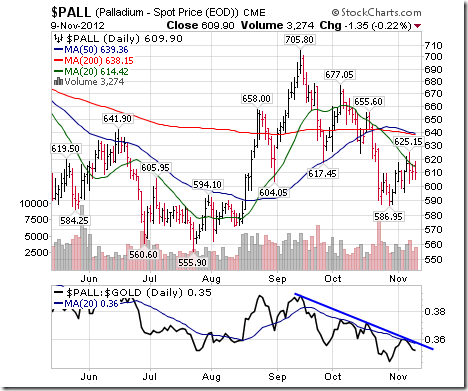
Palladium gained $5.40 per ounce (0.89%) last week. Palladium remains below its 20, 50 and 200 day moving averages. Strength relative to gold remains negative.
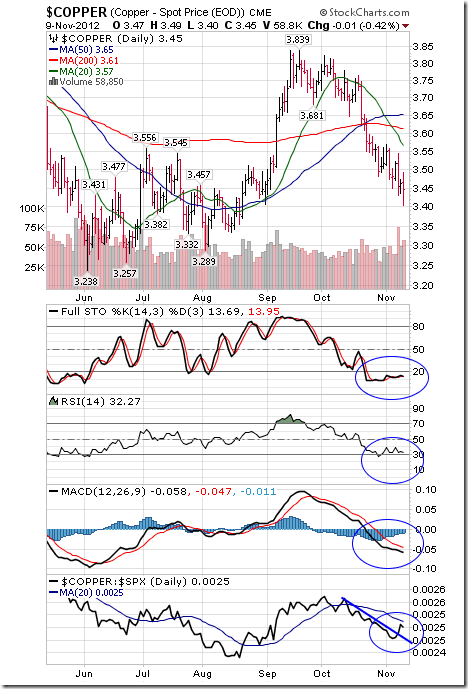
Copper slipped $0.04 per lb. (1.15%) last week. Intermediate trend is down. Copper remains below its 20, 50 and 200 day moving averages. Short term momentum indicators are oversold, but have yet to show signs of bottoming. Strength relative to the S&P 500 Index has been negative, but is showing early signs of change.
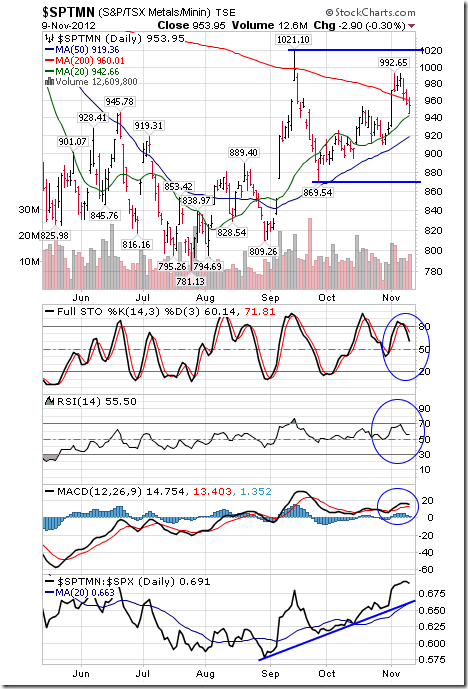
The TSX Metals and Mining Index fell 18.24 points (1.88%) last week. Intermediate trend is up. Short term momentum indicators are overbought and showing signs of rolling over. The Index remains above its 20 and 50 day moving averages, but fell below its 200 day moving average on Friday. Strength relative to the S&P 500 Index remains positive.
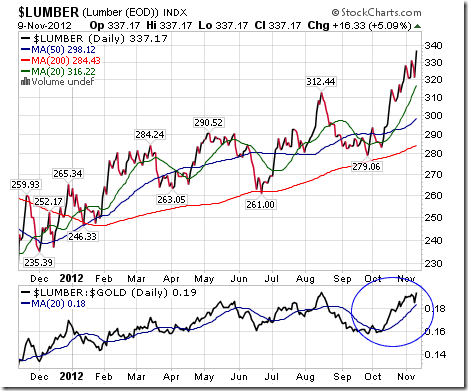
Lumber gained another $16.94 (5.29%) last week to close at a six year high. ‘Tis the season! Lumber remains above its 20, 50 and 200 day moving averages. Strength relative to the S&P 500 Index remains positive.
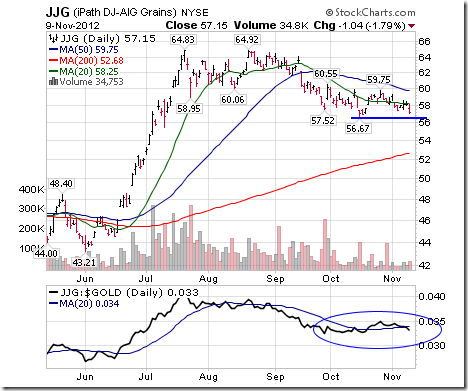
The grain ETN slipped $0.77 (1.23%) last week. Intermediate trend is down. Units trade below their 20 and 50 day MAs. Strength relative to the S&P 500 remains neutral/slightly positive.
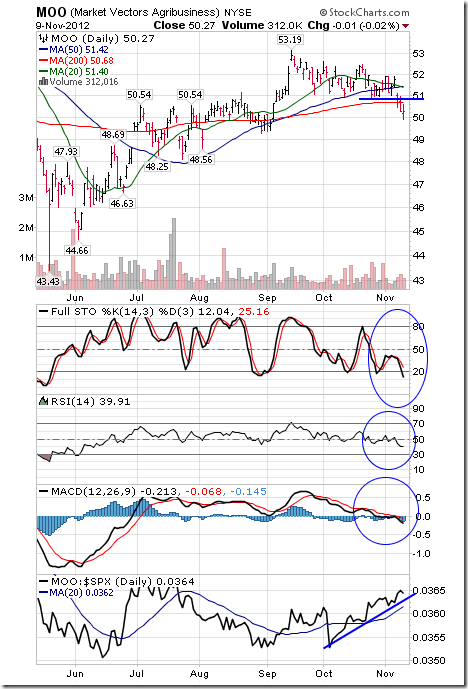
The Agriculture ETF slipped $0.88 (1.72%) last week. Intermediate trend changed from up to down on a break below support at $50.80. Units remain below their 20 and 50 day moving averages and fell below its 200 day moving average on Friday. Short term momentum indicators are trending down. Strength relative to the S&P 500 Index remains positive.
Interest Rates
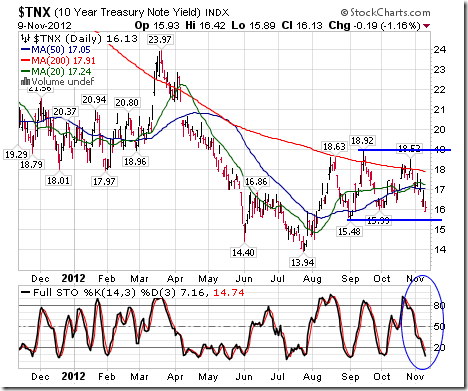
The yield on 10 year Treasuries fell 11.3 basis points (7.09%) last week. Three month trading range is between 1.548% and 18.92%. Short term momentum indicators are trending down and are oversold. Yield fell below its 20, 50 and 200 day moving averages last week.
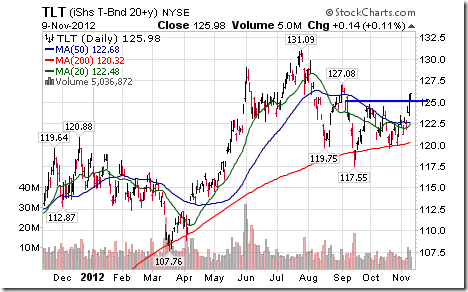
Price of the long term Treasury ETF gained $3.72 (3.04%) last week.
Other Issues
Today is a partial holiday in the U.S. and Canada. Banks are closed, but equity markets are open. Volume will be substantially lower than average.
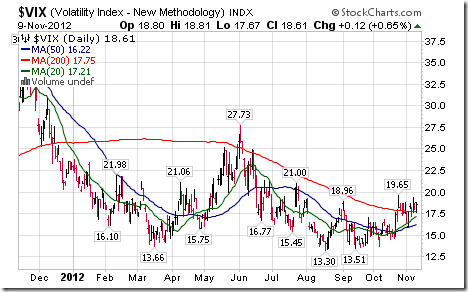
The VIX Index added 1.02 (5.80%) last week. Intermediate trend is up.
The third quarter earnings focus this week is on retail merchandisers.
Economic news this week generally will be bearish (e.g. retail sales, Empire Index, Philadelphia Fed Index, Initial Claims, Industrial Production, Capacity Utilization) reflecting impact of Hurricane Sandy at the end of October.
Short term momentum indicators are deeply oversold. Intermediate technical indicators remain mixed.
Macro events outside of North America will continue to impact equity markets. The Eurogroup meeting today is expected to focus on Greece. China’s regime change process continues this week.
The political focus in the U.S. this week is on a meeting on Friday called by President Obama with Congressional leaders to discuss the Fiscal Cliff. Talk by leaders and Obama following the election pledged willingness to compromise. But talk is cheap! Ideology on both sides remains the roadblock. A successful negotiation of the Fiscal Cliff will have a strong positive impact on equity markets.
Large cash positions held by corporations on both sides of the border have started to move in a small way. Major changes are unlikely until the Fiscal Cliff issue is resolved. Last week IBM announced a new share buy-back program. At least one major company announced plans to distribute its quarterly dividend in December instead of January in order for shareholders to receive taxable income in the 2012 tax year instead of the 2013 tax year when the tax rate on dividends increases from 15% to as high as 39.6%. Now that Obama has been elected, look for international companies based in the U.S. to avoid increased regulation, higher health care costs and higher taxes by using cash to expand in markets outside of the U.S.
Despite moves by broadly based U.S. equity indices to three month lows, favoured seasonal sectors with economic sensitivity maintain positive technical profiles. They including Semiconductors (SMH), Industrials (XLI), Transportation (IYT), Metals and Mining (XME) and Forest Products (CUT).
Long term seasonal influences on equity markets are positive from October 28th to May 5th.
Equity markets in the month of November historically has been strongest in the second half of the month. One of the strongest periods in the year is the period before and after Black Friday (November 22nd this year).
The Bottom Line
Technical action by equity markets was a negative surprise. Furthermore, short term technical action has yet to show signs of bottoming and weak economic news this week attributed to Hurricane Sandy will not help. Preferred strategy is to accumulate equities and Exchange Traded Funds with favourable seasonality at this time of year that already are showing technical signs of performance or outperformance relative to the market (S&P 500 Index for U.S. markets or TSX Composite Index for Canadian markets). Sectors include agriculture, forest products, transportation, industrials, mines & metals, home builders, semiconductors, China and Europe.
Special Free Services available through www.equityclock.com
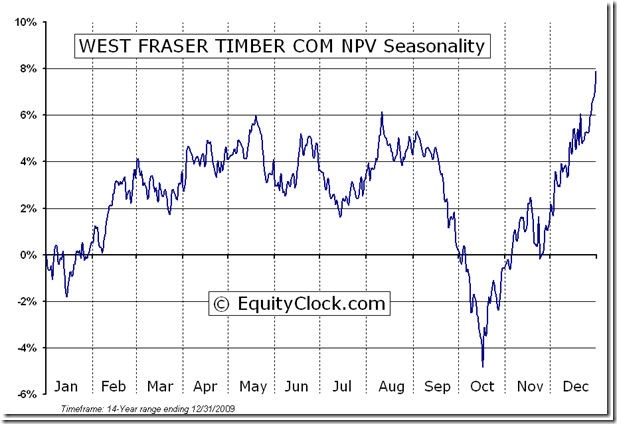
Equityclock.com is offering free access to a data base showing seasonal studies on individual stocks and sectors. The data base holds seasonality studies on over 1000 big and moderate cap securities and indices.
To login, simply go to http://www.equityclock.com/charts/
Following is an example:
West Fraser Timber Co. Ltd. (TSE:WFT) Seasonal Chart
The latest weekly update on ETFs in Canada to November 9th is available at
Tom Rogers’ Weekly Elliott Wave Blog
Following is a link:
http://www.tomrogers.net/signpost.htm
Keith Richards’ Blog
I posted a couple of new blogs recently at www.smartbounce.ca . This week, I contrasted the bullish case for a near-termed gold rally, with the bearish case for continued weakness on crude oil. I also took a fresh look at the investment strategies of Warren Buffett, including a reality check behind the myths surrounding this truly successful investment icon.
Disclaimer: Comments and opinions offered in this report at www.timingthemarket.ca are for information only. They should not be considered as advice to purchase or to sell mentioned securities. Data offered in this report is believed to be accurate, but is not guaranteed.
Don and Jon Vialoux are research analysts for Horizons Investment Management Inc. All of the views expressed herein are the personal views of the authors and are not necessarily the views of Horizons Investment Management Inc., although any of the recommendations found herein may be reflected in positions or transactions in the various client portfolios managed by Horizons Investment Management Inc
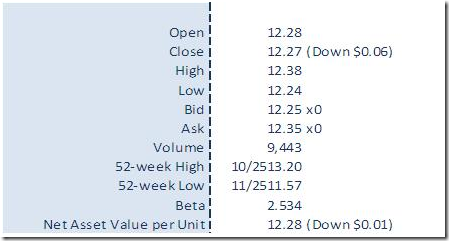
Horizons Seasonal Rotation ETF HAC November 9th 2012
Copyright © TechTalk


