SIA Charts Daily Stock Report (siacharts.com)
In this weeks edition of the SIA Equity Leaders Weekly we are going to take a look at two Commodities that have been bucking some of the negativity surrounding the Commodity Asset Class and as such are areas of interest for those seeking commodity trades within sensitive stocks or the commodity directly.
Gold Continuous Contract (GC.F)
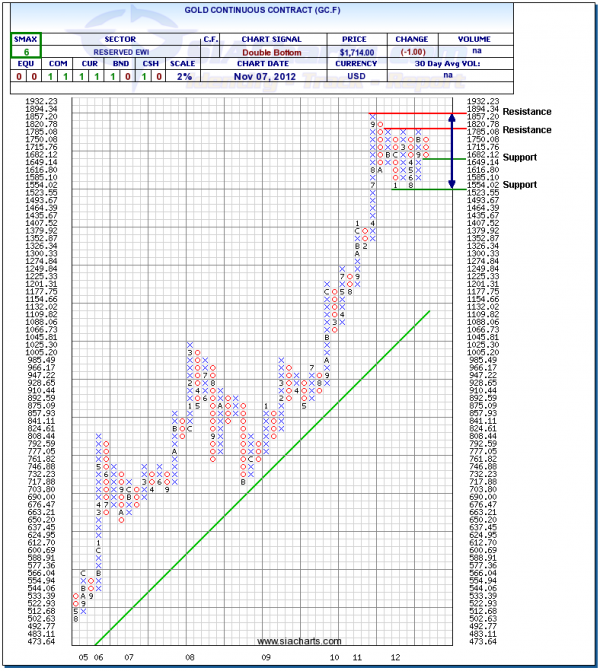
The first chart we are going to look at is the Gold Bullion chart. Although gold has not advanced above its highs from September of 2011, it has managed to escape the downside that other metals have seen in the last year.
The chart shows us that Gold has consolidated since pulling back in October of 2011 and currently remains in the middle of a range between $1,523.55 on the bottom and $1,820.78 on the top. Should bullion find its way above resistance the next major test will be in the $2,000 range. To the downside a close below support sees room to the $1,400 range.
Natural Gas Continuous Contract (NG.F)
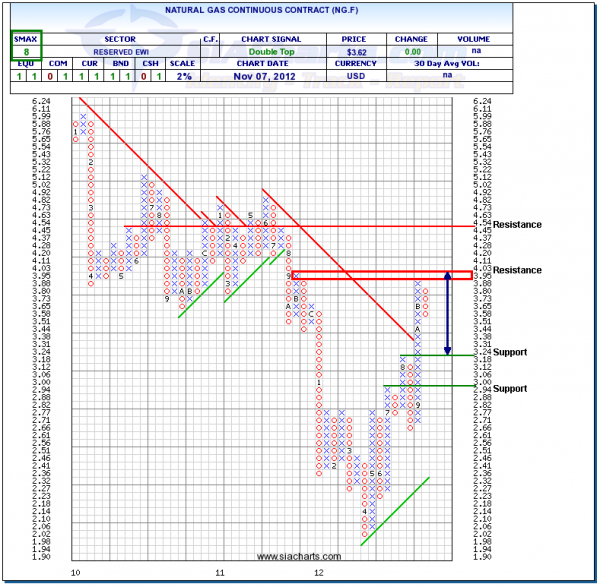
Natural Gas has been a commodity on the mend since bottoming in April of 2012. Since reaching a low of $2.00 we have seen Natural Gas reach new highs on all subsequent bullish moves, with the important resistance of its downtrend line taken out in September.
Looking at the chart today we can see that resistance held below $3.95 and Natural Gas sits in the middle of its trading range between $3.18 and $4.03. A close to the upside suggests room to the mid $4's for Natural Gas, while a close below sees room to the $3 level.
Copyright © siacharts.com


