by Richard Shaw, QVM Group LLC
There is a substantial debate about what asset, if any, gold price relates to or responds to. We think its price is more responsive to perceived changes in its monetary alternative potential than to changes in its jewelry or industrial demand (including that a significant portion of the jewellery demand in some countries is as much a form of investment as decoration).
We think the most logical factor in its price as a form of money would be the ratio of the currency in circulation versus the amount of gold that could be associated with that currency (most probably, the amount of currency in circulation for the dominant currencies versus the amount of gold held in the central banks that issue those dominant currencies).
We have heard some strong opinions to the contrary ranging from that is no basis for gauging the value of gold because it just is what it is — as one gold dealer said “price doesn’t matter”; its a “philosophy” and an “insurance policy against government foolishness”. Of course, that logic goes nowhere toward establishing a current value, but perhaps some other assets other than currency in circulation could be used to explain gold price behavior, and therefore provide some gauge of over and under valuation in the market price.
Price and value are not the same thing, but as investors it is helpful to strive to tell the difference.
Our Preferred Gold Valuation Metric:
We like the ratio of the currency in circulation in the United States and Europe to the gold held in their combined central banks. That number is around $4,000; and would grow as the issued paper money increases, assuming no increase in the gold held by the central banks.
That $4,000 round number comes from summing the US dollar equivalent of all Dollar and Euro currency in circulation ($2.64 Trillion) and dividing it by the sum of the gold held by the US and European Monetary Union central banks (667.4 million ounces), which comes out to be $3,955 per ounce.
In other words, if there were ever a return to full convertibility to gold, that is the price at which all currency if converted would cause the payout of all central bank gold holdings. We don’t think convertibility will return, but so long as central banks continue to hold gold, they keep the concept of potential convertibility alive, and as long as a large number of gold buyers think gold is a “real money” alternative to fiat currency, this convertibility calculation has some bearing on the current investment value of gold at any time.
We should also note that if another major market problem like that in 2008 should arise (say in the next few months if the fiscal cliff issue is bungled), gold could drop as much as it did in 2008. That drop was 30%. If you take 30% off of the most recent high for gold, you get $1,300. That is plausible, not probable, and would likely be temporary, but it could happen.
Other Investments Versus Gold:
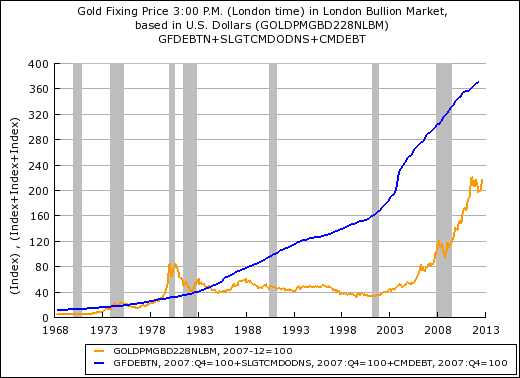
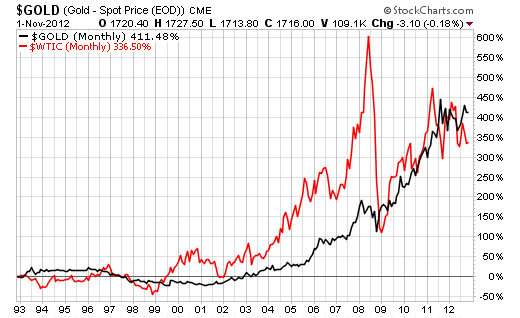
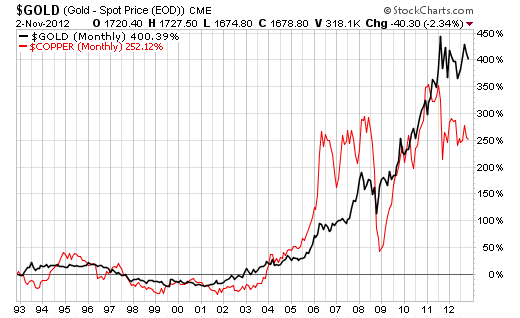
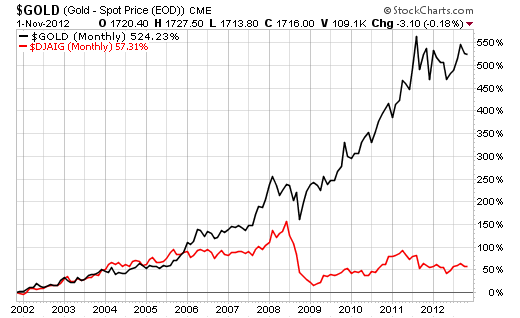
You may disagree and you may feel that other assets are better correlates or value drivers, so we put together this batch of charts that show gold versus various other investments on an indexed basis that may help you think through which, if any, you find to be a good yardstick to help you know when gold is priced too high or too low versus some sense of value.
The data is either from the US Federal Reserve or from StockCharts.com. Data is from 1969 for most of the Federal Reserve charts and for 20 years for most of the charts from StockCharts. In each case we present the data on an indexed basis so the relative change in each plot is more easily discernible.
The comparisons may be interesting if nothing else.
Gold vs. US Currency In Circulation

Gold vs. M0 (currency), M1 and M2

Gold vs. US Federal Debt

Gold vs. Combined Federal, State and Local Debt

Gold vs. Federal, State and Local Debt, Plus Household Debt

Gold vs. GDP

Gold vs. Cost of Living (as measured by “all items” CPI)

Gold vs. US Stocks (S&P 500)

Gold vs. US Dollar Index

Gold vs. West Texas Crude Oil

Gold vs. Copper

Gold vs. Silver

Gold vs. Corn and Soybeans

Gold Versus 10-Year Treasury Yield

Gold vs. Dow Jones AIG Commodity Index (includes gold)

Directly Related Gold ETFs: GLD, IAU, SGOL, IAU
Copyright © QVM Group LLC


