SIA Charts Daily Stock Report (siacharts.com)
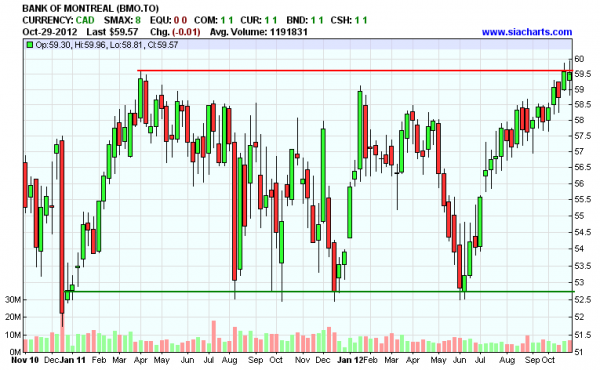
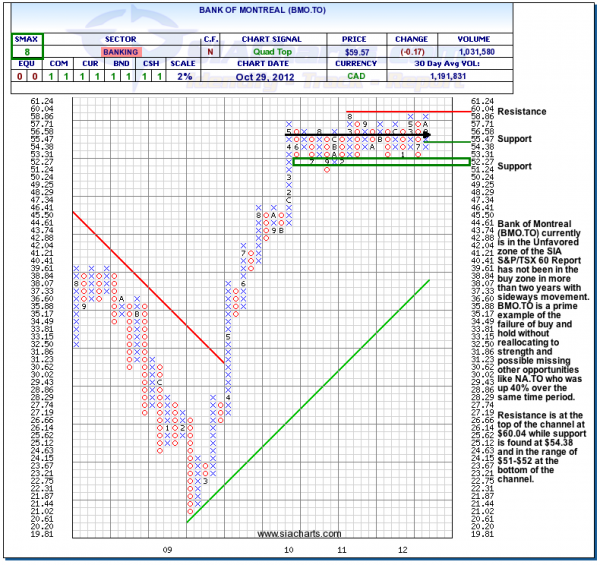
Bank of Montreal (BMO.TO) October 30, 2012 - Bank of Montreal (BMO.TO) currently is in the Unfavored zone of the SIA S&P/TSX 60 Report has not been in the buy zone in more than two years with sideways movement. BMO.TO is a prime example of the failure of buy and hold without reallocating to strength and possible missing other opportunities like NA.TO which was up 40% over the same time period.
Resistance is at the top of the channel at $60.04 while support is found at $54,38 and in the range of $51-$52 at the bottom of the channel.
Green - Favoured Zone
Yellow - Neutral Zone
Red - Out of Favour Zone
(click to enlarge)
Important Disclaimer
SIACharts.com specifically represents that it does not give investment advice or advocate the purchase or sale of any security or investment. None of the information contained in this website or document constitutes an offer to sell or the solicitation of an offer to buy any security or other investment or an offer to provide investment services of any kind. Neither SIACharts.com (FundCharts Inc.) nor its third party content providers shall be liable for any errors, inaccuracies or delays in content, or for any actions taken in reliance thereon.
Copyright © siacharts.com


