SIA Charts Daily Stock Report (siacharts.com)
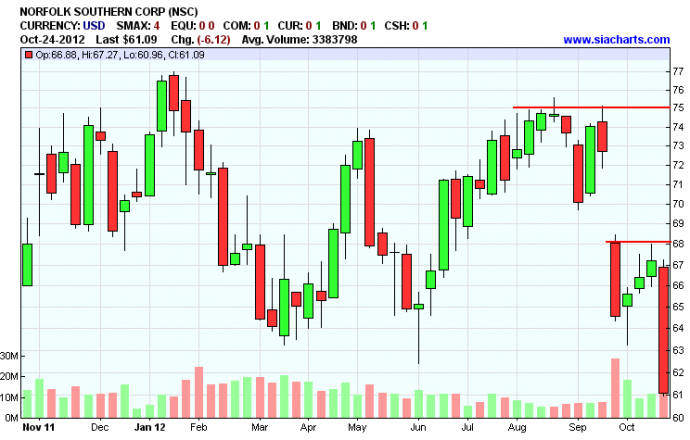
Norfolk Southern Corp (NSC) - After falling out of the Favored zone of the SIAS&P 100 Report back in February 2012, Norfolk Southern (NSC) has dropped over 15% and is now down towards the bottom of the report. Resistance is at $66.89 and again at $76.84. Support is now at $58.23 and again at $51.71.
Green - Favoured Zone
Yellow - Neutral Zone
Red - Out of Favour Zone
Important Disclaimer
SIACharts.com specifically represents that it does not give investment advice or advocate the purchase or sale of any security or investment. None of the information contained in this website or document constitutes an offer to sell or the solicitation of an offer to buy any security or other investment or an offer to provide investment services of any kind. Neither SIACharts.com (FundCharts Inc.) nor its third party content providers shall be liable for any errors, inaccuracies or delays in content, or for any actions taken in reliance thereon.
Copyright © siacharts.com


