by Don Vialoux
Upcoming US Events for Today:
- Housing Starts for September will be released at 8:30am. The market expects 765K versus 758K previous. Permits are expected to show 810K versus 801K previous.
- Weekly Crude Inventories will be released at 10:30am.
Upcoming International Events for Today:
- Bank of England Minutes will be released at 4:30am EST.
- Great Britain Jobless Claims Change for September will be released at 4:30am EST. The market expects 0 (unchanged) versus a decline of 15,000 previous.
- China GDP for the Third Quarter will be released at 10:00pm EST. The market expects a year-over-year increase of 7.4% versus an increase of 7.6% previous.
The Markets
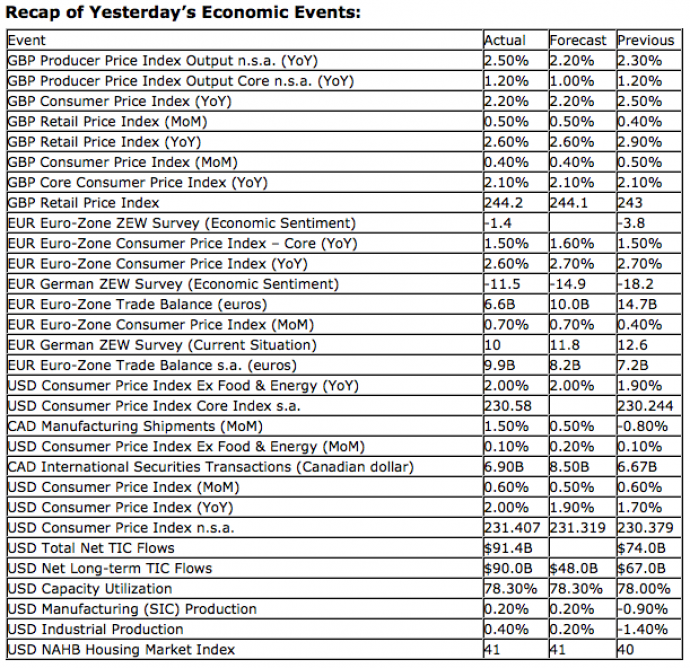
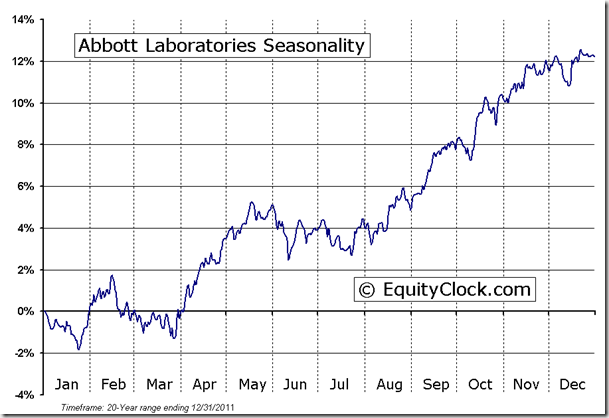
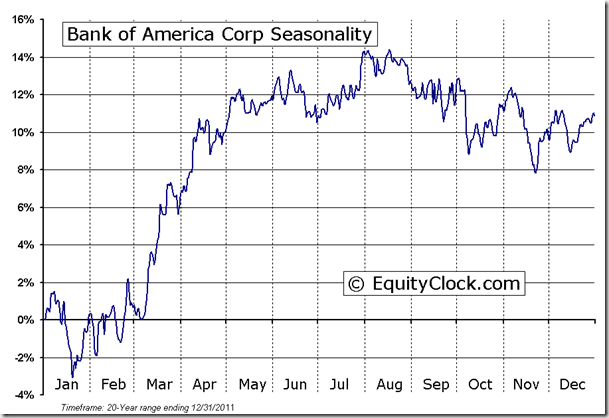
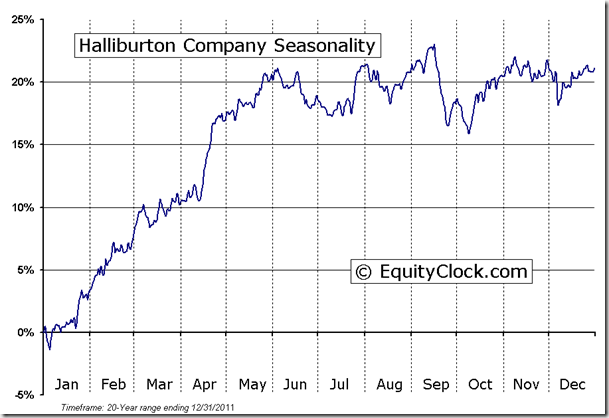
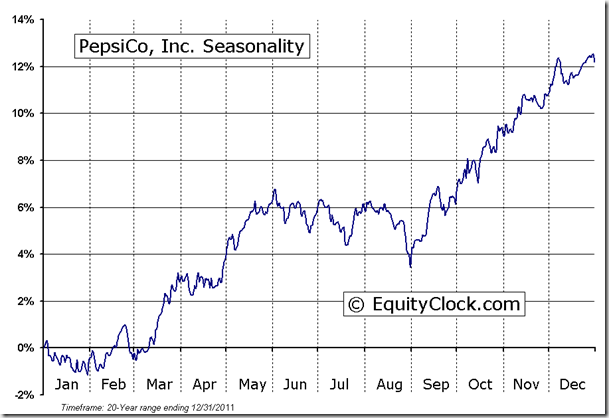
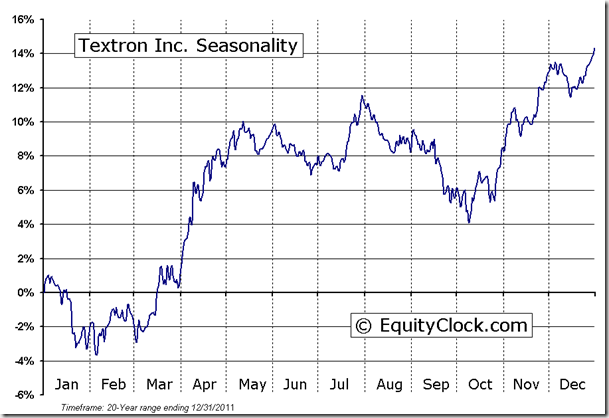
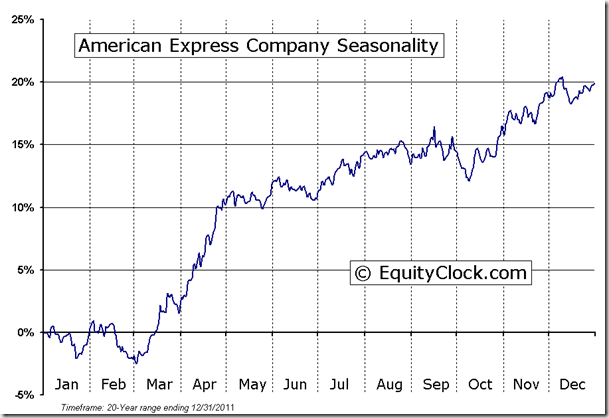
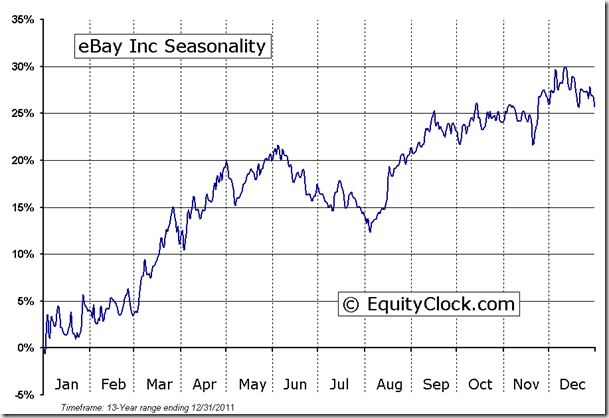
Equity markets surged higher on Tuesday, boosted by earnings optimism, industrial production numbers that beat expectations, and comments pertaining to aid for Spain. Concern over earnings is showing signs of alleviating as more companies are beating expectations than missing. Goldman Sachs, Johnson & Johnson, Mattel, and United Health are among the companies that reported better than expected results on Tuesday. Still, the reaction to results is very much mixed with stocks either trading firmly higher or lower, keeping investors cautious as we enter the some of the busiest days for earnings season next week. Companies reporting today include Abbott Laboratories, Bank of America, Halliburton, Pepsico, Textron, American Express, and eBay.
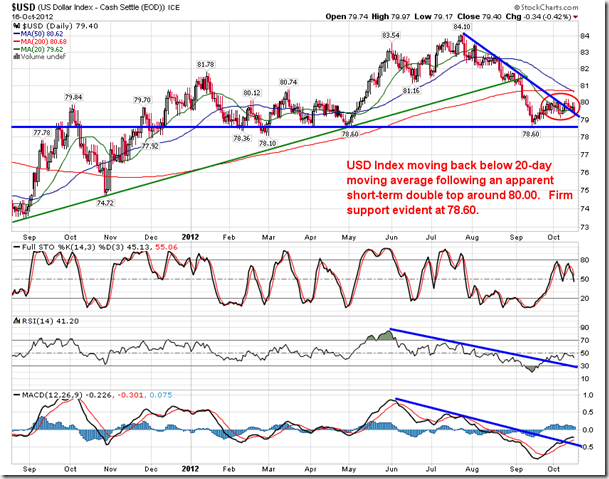
Also fueling growth in risk assets on Tuesday was a report that two German lawmakers said the country is open to credit aid for Spain ahead a summit of European Union leaders on Thursday. The Euro surged on the remarks, trading higher by almost 1%, putting pressure on the US Dollar in the process. The US Dollar index is now trading back below its 20-day moving average, rolling over from an apparent short-term double top pattern. Firm support is evident on the charts at 78.60, marking this a significant hurdle to overcome in the currency’s push toward lower levels. Seasonal tendencies for the US Dollar remain flat to positive in October and November.
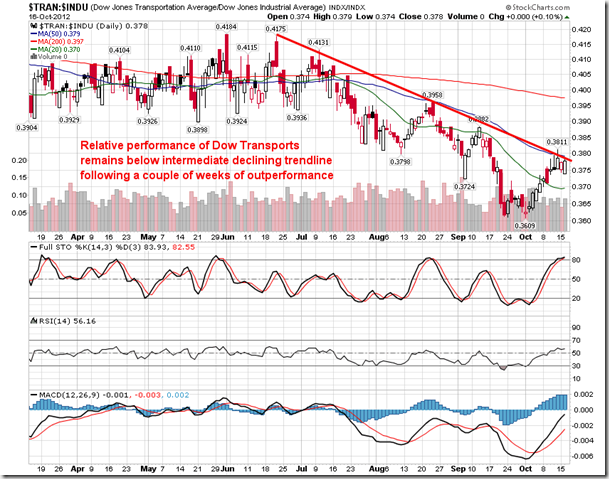
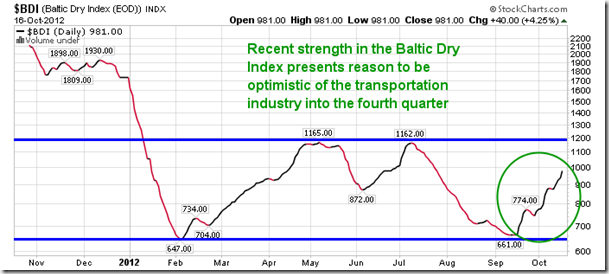
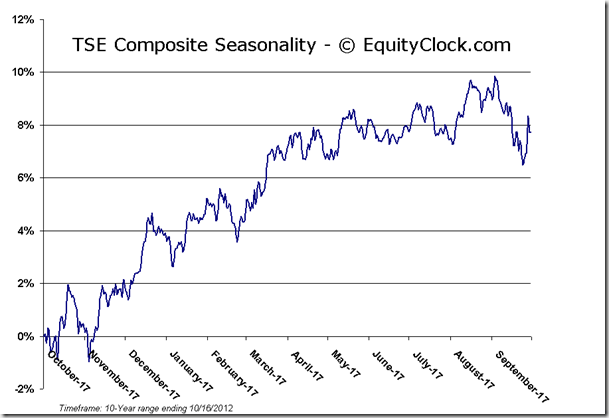
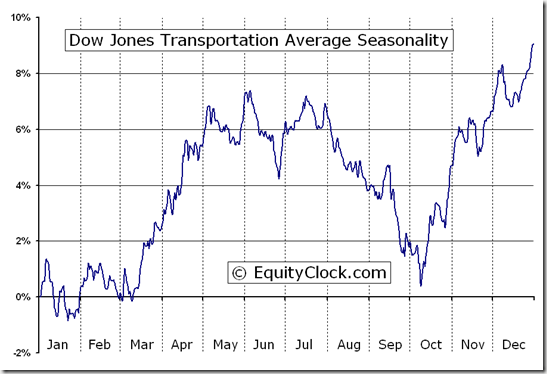
We’ve reached an interesting juncture for Dow Theory as the Transports finally show signs of outperformance over recent days. The chart of the Dow Transports relative to the Dow Jones Industrial Average shows that the recent outperformance has pushed the relative price action back to the intermediate-term declining trendline as the transports finally make a push to regain lost ground compared to other indices. The transports have been lagging for the bulk of the year as the industry reflects the struggling fundamental condition of the worldwide economy. Recent strength in the Baltic Dry Index following a bounce near an area of support is optimistic for the industry going into the end of the year. Transportation stocks enter a period of seasonal strength in the month of October, running through to May as cyclical stocks gain during the favourable six month period for equities.
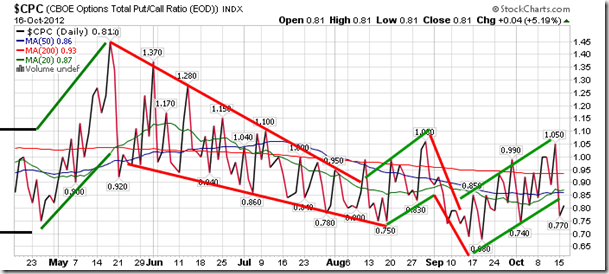
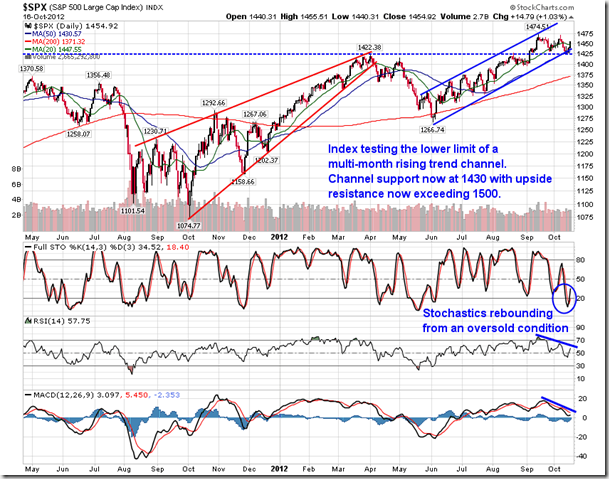
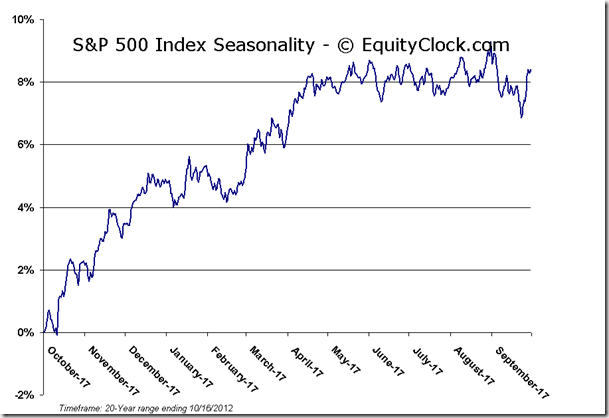
Sentiment on Tuesday, as gauged by the put-call ratio, ended bullish at 0.81. The ratio continues to trade below the recent rising trend channel, suggesting a change in sentiment away from the pessimistic tone that dominated markets coming into earnings season. Over the next two weeks, earnings report releases will be plentiful with almost 1500 companies providing quarterly results. Seasonal tendencies suggest a brief pullback somewhere in between this core period in the reporting cycle as reports are digested. As positive seasonal tendencies attempt to gain a firm footing, volatility over the coming weeks is expected as investors continue to receive earnings reports and speculation grows over which candidate will win the the role of the President.
Chart Courtesy of StockCharts.com
Chart Courtesy of StockCharts.com
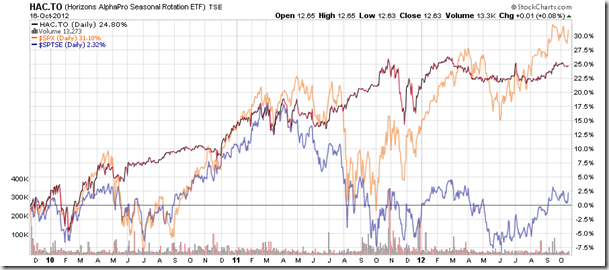
Horizons Seasonal Rotation ETF (TSX:HAC)
- Closing Market Value: $12.63 (up 0.08%)
- Closing NAV/Unit: $12.64 (up 0.12%)
Performance*
| 2012 Year-to-Date | Since Inception (Nov 19, 2009) | |
| HAC.TO | 3.79% | 26.4% |
* performance calculated on Closing NAV/Unit as provided by custodian
Click Here to learn more about the proprietary, seasonal rotation investment strategy developed by research analysts Don Vialoux, Brooke Thackray, and Jon Vialoux.
Copyright © Don Vialoux


