Economic News This Week
September Retail Sales to be released on Monday at 8:30 AM EDT are expected to increase 0.7% versus a gain of 0.9% in August. Excluding autos, Retail Sales are expected to increase 0.8% versus a gain of 0.6% in August.
The September Empire State Manufacturing Index to be released at 8:30 AM EDT on Monday is expected to improve to -2.8 from -10.4 in August.
August Business Inventories to be released at 10:00 AM EDT on Monday are expected to increase 0.5% versus a gain of 0.8% in July.
September Consumer Prices to be released at 8:30 AM EDT on Tuesday are expected to increase 0.5% versus a gain of 0.6% in August. CPI ex food and energy is expected to increase 0.2% versus a gain of 0.1% in August
September Industrial Production to be released at 9:15 AM EDT on Tuesday is expected to increase 0.2% versus a decline of 1.2% in August. September Capacity Utilization is expected to increase to 78.3% from 78.2% in August.
September Housing Starts to be released at 8:30 AM EDT on Wednesday are expected to increase to 768,000 from 750,000 in August.
Weekly Initial Claims to be released at 8:30 AM EDT on Thursday are expected to increase to 360,000 from 339,000 last week.
The October Philadelphia Fed Index to be released at 10:00 AM EDT on Thursday is expected to improve to -0.1 from -1.2 in September.
September Leading Indicators to be released at 10:00 AM EDT on Thursday are expected to improve 0.2% versus a decline of 0.1% in August.
September Canadian Consumer Prices to be released at 8:30 AM EDT on Friday are expected to increase 0.3% versus a gain of 0.2% in August
September Existing Home Sales to be released at 10:00 AM EDT on Friday are expected to slip to 4.70 million units from 4.82 million units in August.
Earnings News This Week
Monday: Citigroup, Gannett
Tuesday: CSX, Goldman Sachs, Intel, IBM, Johnson & Johnson, State Street, United Healthcare
Wednesday: Abbott Labs, American Express, Bank of New York , Bank of America, Comerica, eBay, Noble Corp., Northern Trust, Pepsico, Quest Diagnostics, St. Jude Medical, Stryker, US Bancorp, Xilinx.
Thursday: Advance Micro Devices, Baxter International, BB&T Bank, Capital One, Fifth Third, Google, Microsoft, Morgan Stanley, Nucor, Phillip Morris, Robert Half, SanDisk, Southwestern Air, Travellers, Union Pacific, Verizon.
Friday: Air Products, Baker Hughes, Ingersoll Rand, McDonalds, Parker Hannifin, Schlumberger.
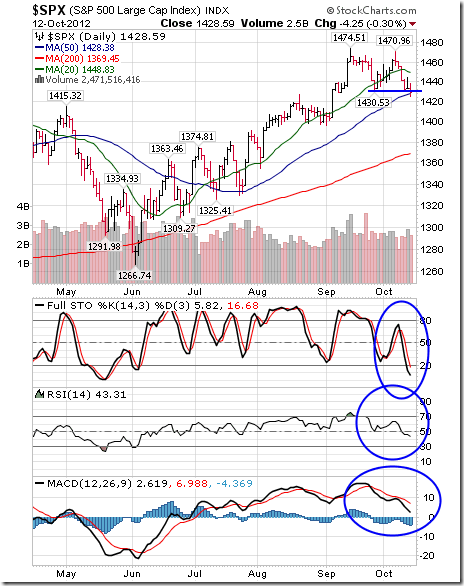
The S&P 500 Index fell 32.34 points (2.21%) last week. Intermediate trend changed on Friday from up to down on a break below support at 1,430.53. The Index is down 3.11% since its September 14th high at 1,474.51. Short term momentum indicators are trending down. Stochastics already are oversold, but have yet to show signs of bottoming.
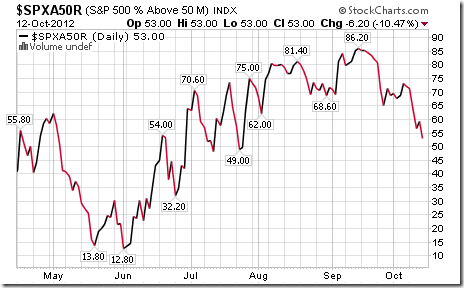
Percent of S&P 500 stocks trading above their 50 day moving average plunged last week to 53.00% from 72.00%. Percent remains intermediate overbought and trending down.
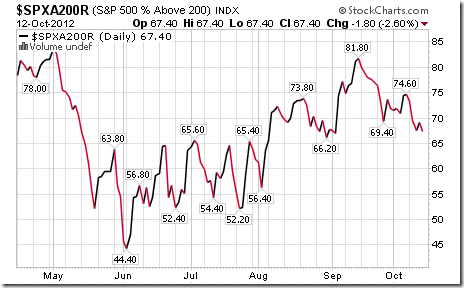
Percent of S&P 500 stocks trading above their 200 day moving average fell last week from 74.60% from 67.40%. Percent remains intermediate overbought and trending down.
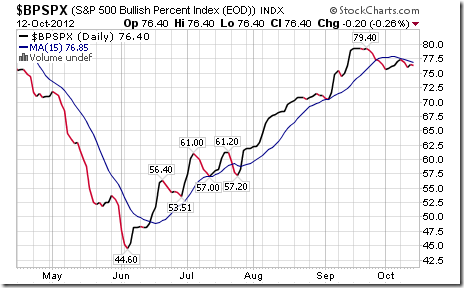
Bullish Percent Index for S&P 500 stocks slipped last week to 76.40% from 77.00% and remained below its 15 day moving average. The Index remains intermediate overbought and trending down.
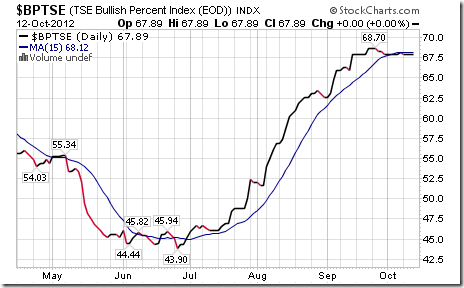
Bullish Percent Index for TSX Composites stocks slipped last week to 67.89% from 68.16% and remained below its 15 day moving average. The Index remains intermediate overbought and showing signs of rolling.
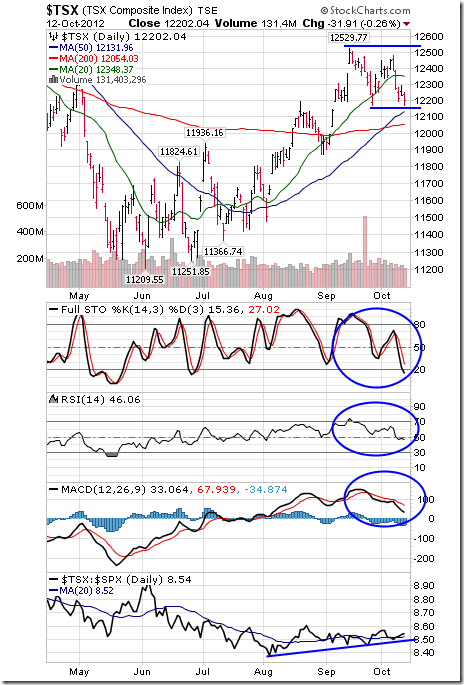
The TSX Composite Index fell 216.95 points (1.75%) last week. Intermediate trend is up. Support has formed at 12,168.10. Resistance is at its September 14th high at 12,529.77. The Index remains above its 50 and 200 day moving averages, but fell below its 20 day moving average last week. Short term momentum indicators are trending down. Stochastics already are oversold, but have yet to show signs of bottoming. Strength relative to the S&P 500 Index is neutral, but showing early signs of outperformance.
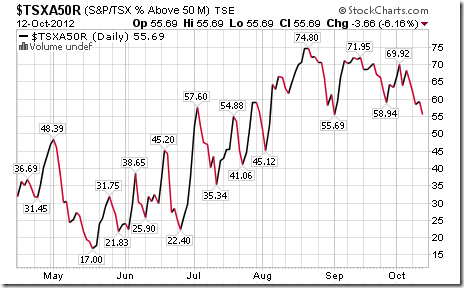
Percent of TSX stocks trading above their 50 day moving average plunged last week to 55.59% from 66.31%. Percent remains intermediate overbought and trending down.
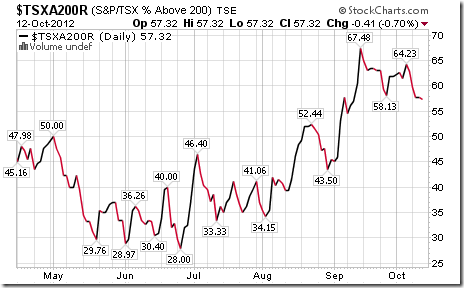
Percent of TSX stocks trading above their 200 day moving average fell last week to 57.32% from 62.86%. Percent remains intermediate overbought and trending down.
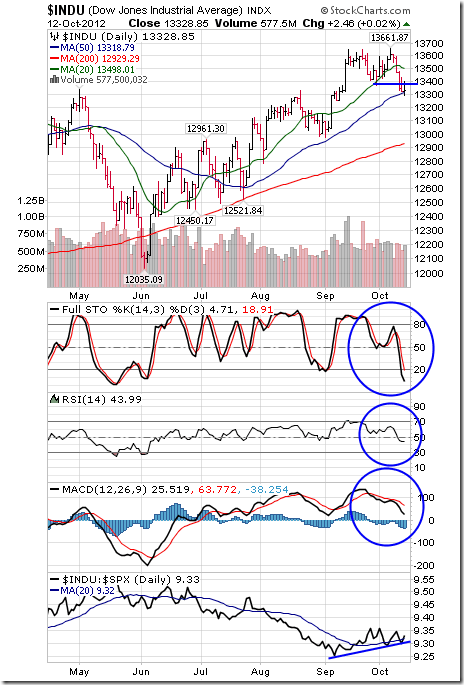
The Dow Jones Industrial Average fell 282.10 points (2.07%) last week. Intermediate trend changed last week from up to neutral on a break below support at 13,367.27. The Index remains above its 50 day and 200 day moving averages, but fell below its 20 day moving average last week. Short term momentum indicators are trending down. Stochastics are oversold, but have yet to show signs of bottoming.
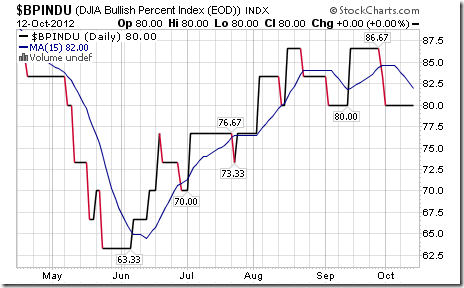
Bullish Percent Index for Dow Jones Industrial Average was unchanged last week at 80.00% and remained below its 15 day moving average. The Index remains intermediate overbought.
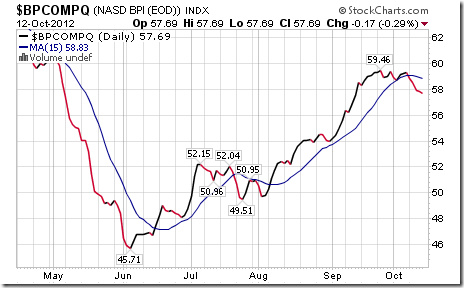
Bullish Percent for NASDAQ Composite stocks fell last week to 57.69% from 59.30% and dropped below its 15 day moving average. The Index is intermediate overbought and trending down.
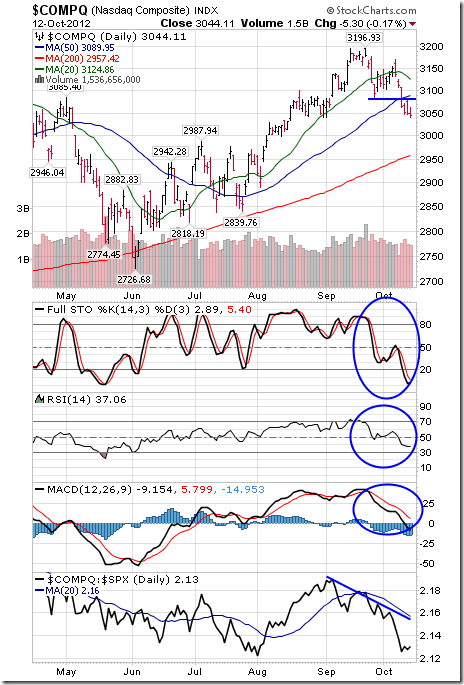
The NASDAQ Composite Index lost 92.08 points (2.94%) last week. Intermediate trend changed from up to down on a break below support at 3,080.28. The Index remained below its 20 day moving average and fell below its 50 day moving average. Short term momentum indicators are trending down. Stochastics already are oversold, but have yet to show signs of bottoming. Strength relative to the S &P 500 Index remains negative.
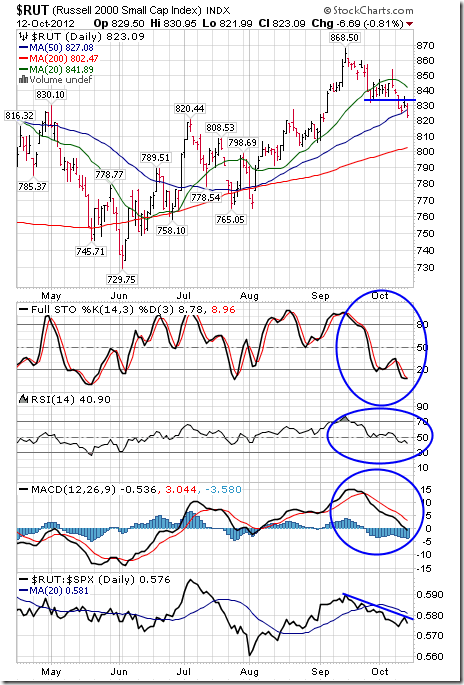
The Russell 2000 Index fell 23.09 points (2.35%) last week. Intermediate trend changed from up to down on a break below support at 831.82. The Index remains below its 20 day moving average and fell below its 50 day moving average on Friday. Short term momentum indicators are trending down. Stochastics already are oversold, but have yet to show signs of bottoming. Strength relative to the S&P 500 Index has turned negative.
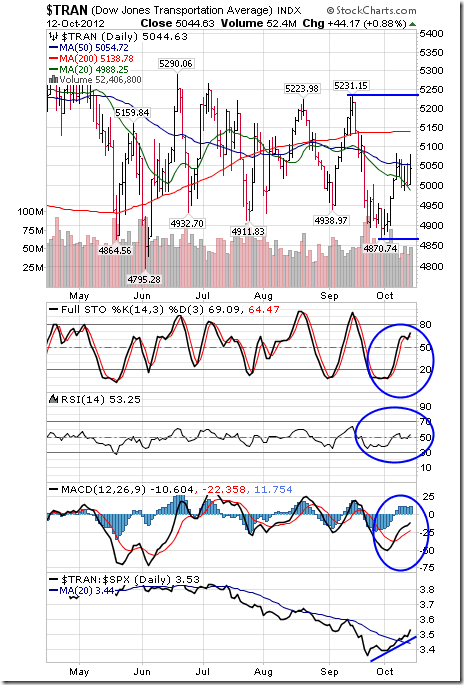
The Dow Jones Transportation Average slipped 1.80 points (0.04%) last week. Intermediate trend is neutral. Support is at 4,870.74 and resistance is at 5,231.15. The Average remains above its 20 day moving average and moved above its 50 day moving average. Strength relative to the S&P 500 Index has turned positive. Seasonal influences have turned positive.
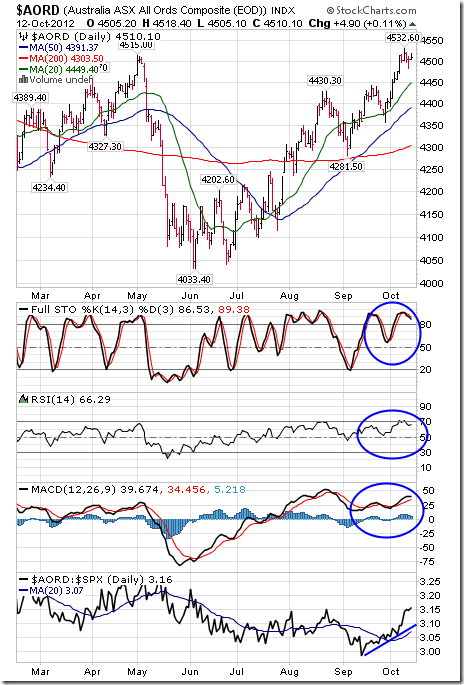
The Australia All Ordinaries Composite Index slipped 3.70 points (0.08%) last week. Intermediate trend is up. The Index remains above its 20, 50 and 200 day moving averages. Short term momentum indicators are overbought and showing early signs of rolling over. Strength relative to the S&P 500 Index has turned positive.
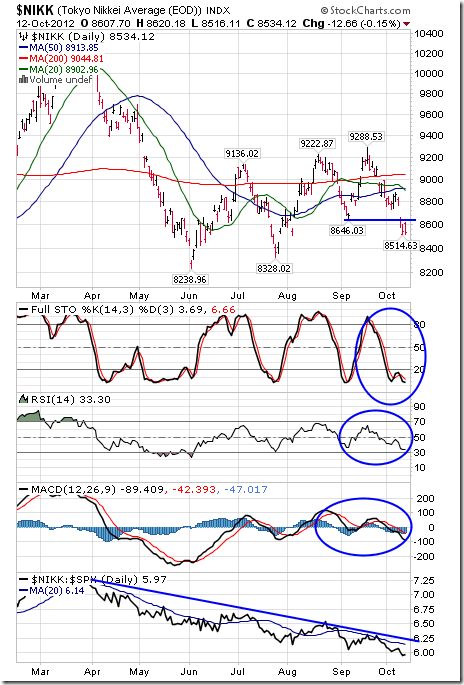
The Nikkei Average plunged 329.18 points (3.71%) last week. Intermediate trend changed from up to neutral on a break below support at 8,646.03. Short term momentum indicators are oversold, but have yet to show signs of bottoming. Strength relative to the S&P 500 Index remains negative.
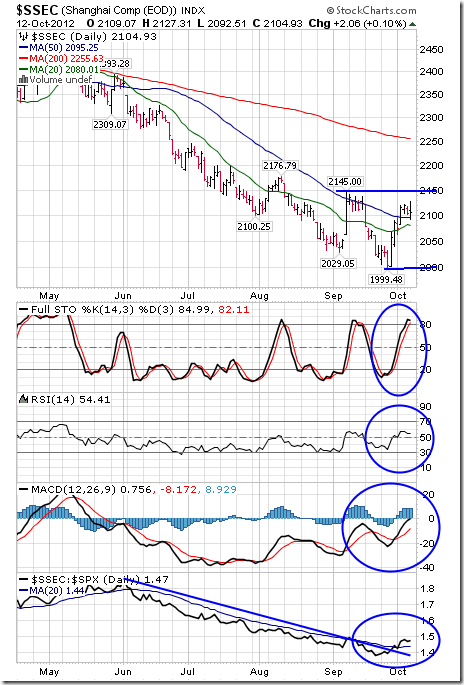
The Shanghai Composite Index gained 18.76 points (0.90%) last week. Intermediate trend remains down. Support has formed at 1,999.48. The Index remains above its 20 day moving average and moved above its 50 day moving average. Short term momentum indicators are trending higher. Stochastics already are overbought, but have yet to show signs of peaking. Strength relative to the S&P 500 Index has changed from negative to positive.
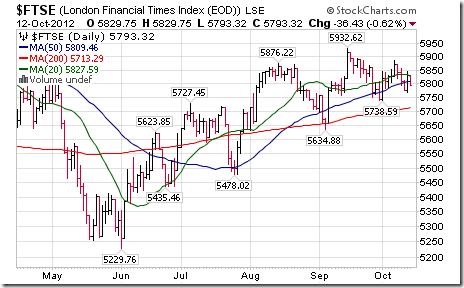
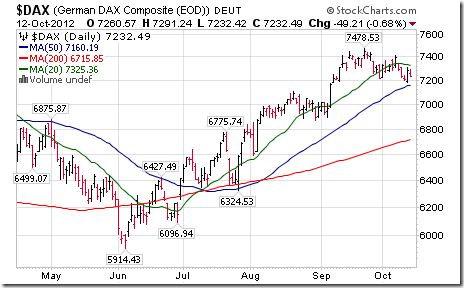
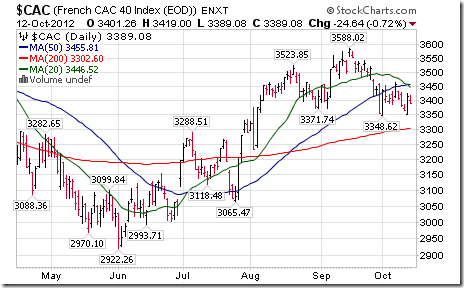
The London FT Index slipped 34.46 points (0.59%), the Frankfurt DAX Index gave up 72.72 points (1.00%) and the Paris CAC Index fell 12.12 points (0.36%) last week.
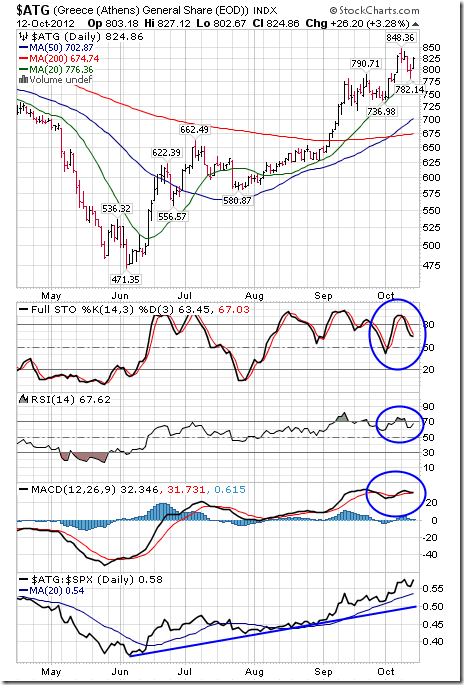
The Athens Index slipped 5.10 points (0.61%) last week. Intermediate trend is up. The Index remains above its 20, 50 and 200 day moving averages. Short term momentum indicators are overbought and showing signs of rolling over. Strength relative to the S&P 500 Index remains positive.
Currencies
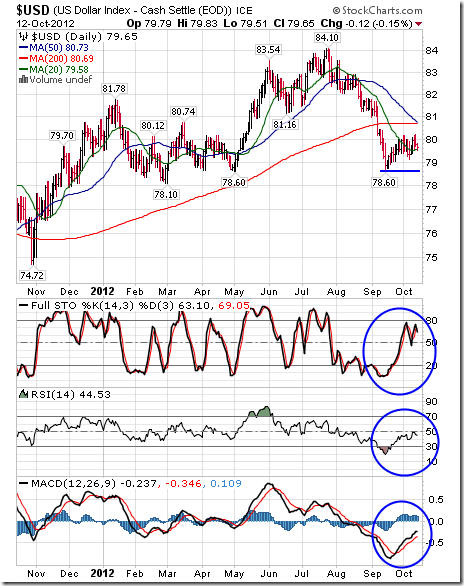
The U.S. Dollar Index added 0.31 (0.39%) last week. Support has formed at 78.60. The Dollar remains below its 50 and 200 day moving averages, but moved above its 20 day moving average. Short term momentum indicators are trending higher.
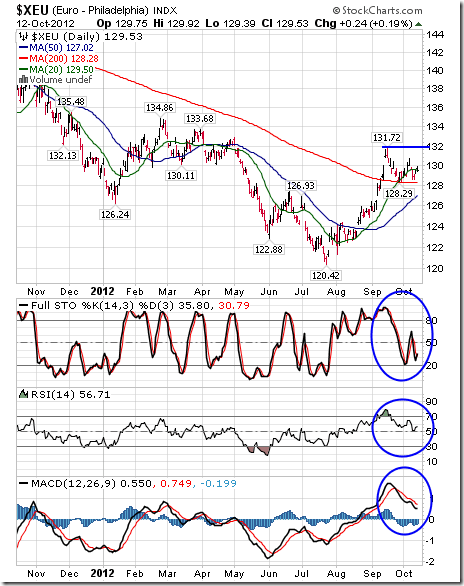
The Euro slipped 0.77 (0.59%) last week. Intermediate trend remains neutral. Resistance has formed at 131.72. The Euro remains above its 20, 50 and 200 day moving averages. Short term momentum indicators are trending down.
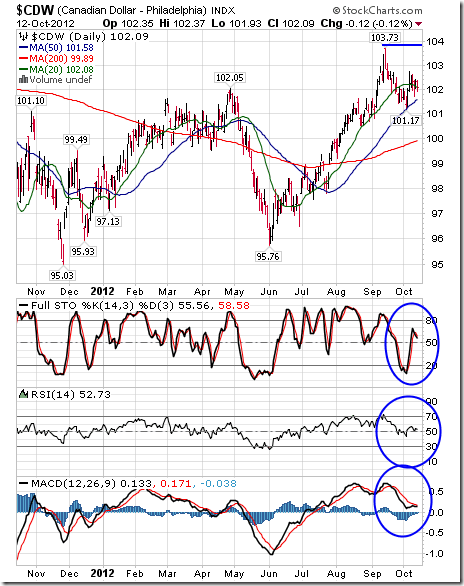
The Canadian Dollar slipped 0.10 U.S. cents (0.10%) last week. Intermediate trend is up. Resistance has formed at 103.79. The Canuck Buck remains above its 20, 50 and 200 day moving averages. Short term momentum indicators are neutral.
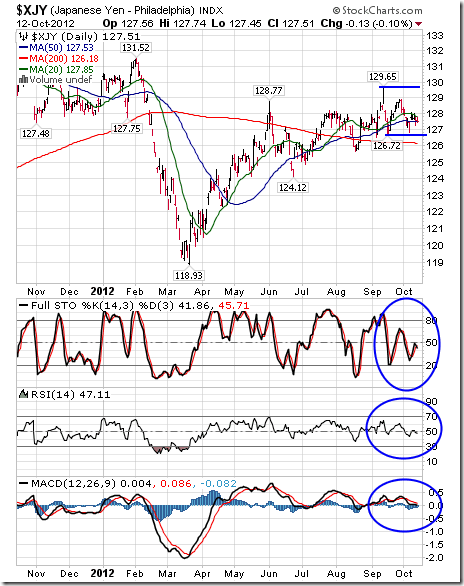
The Japanese Yen added 0.36 (0.28%) last week. Intermediate trend is up. Support is at 126.72 and resistance is at 129.65. The Yen remains above its 200 day moving average and below its 20 and 50 day moving averages. Short term momentum indicators are neutral.
Commodities
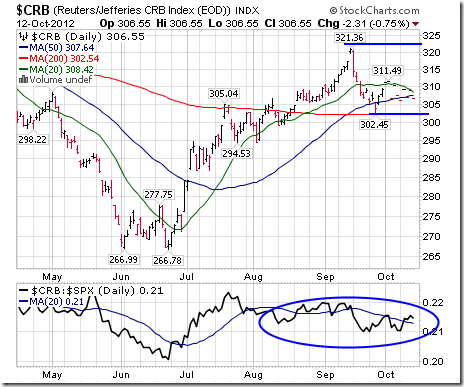
The CRB Index fell 1.07 points (0.35%) last week. Intermediate trend is up. The Index remains above its 200 day moving average, but fell below its 50 day moving average last week. Strength relative to the S&P 500 Index is neutral/slightly negative.
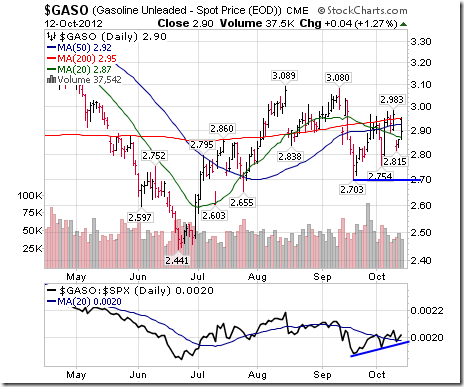
Gasoline slipped $0.05 per gallon (1.69%) last week. Gasoline fell below its 20 and 50 day moving averages. Strength relative to the S&P 500 Index has changed from neutral to positive.
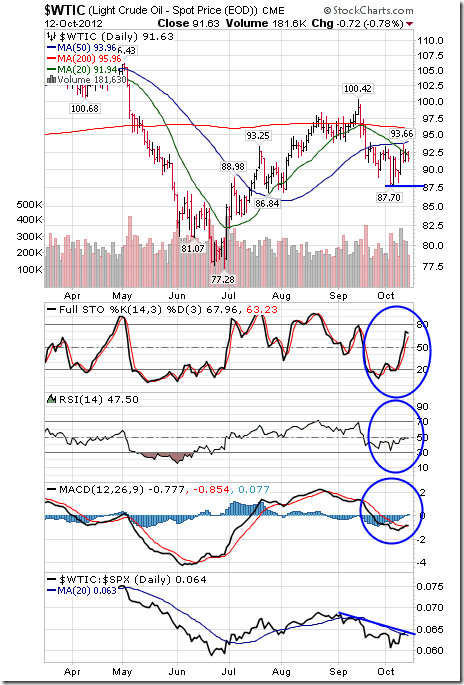
Crude Oil added $1.55 per barrel (1.72%) last week. Intermediate trend is neutral. Resistance is at $100.42. Support has formed at $87.70. Crude oil remains below its 20, 50 and 200 day moving averages. Short term momentum indicators are trending higher. Strength relative to the S&P 500 Index is negative, but showing signs of change.
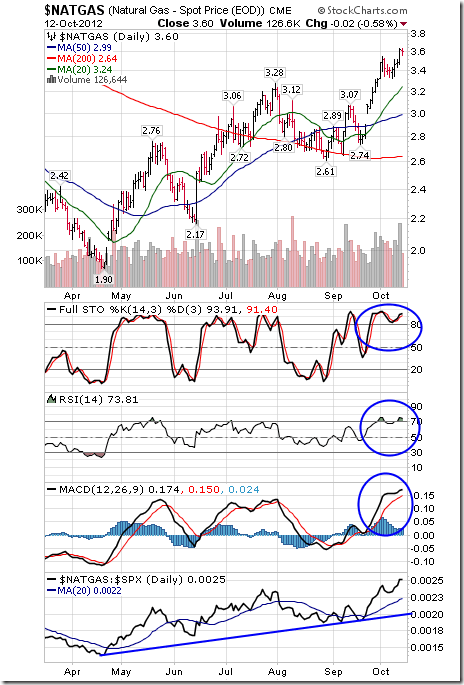
Natural gas added $0.20 (5.88%) last week. Intermediate trend is up. Short term momentum indicators are overbought, but have yet to show signs of peaking. Gas remains above its 20, 50 and 200 day moving averages. Strength relative to the S&P 500 Index remains positive.
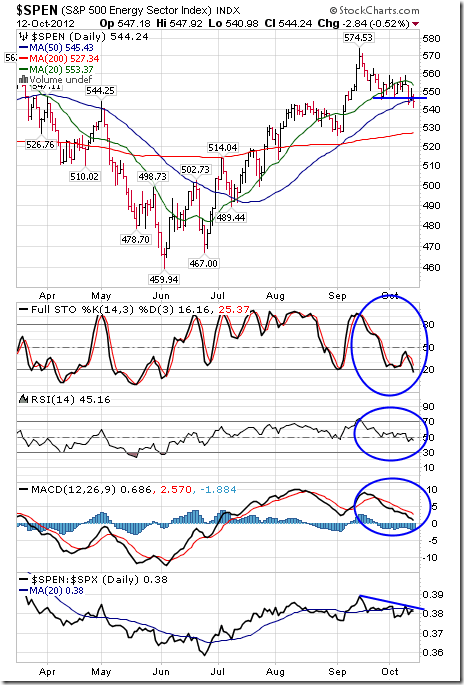
The S&P Energy Index fell 8.69 points (1.57%) last week. Intermediate trend changed from up to down on a break below support at 545.89. The Index remains below its 20 day moving average and fell below its 50 day moving average. Short term momentum indicators are trending down. Stochastics already are oversold, but have yet to show signs of bottoming. Strength relative to the S&P 500 Index remains negative.
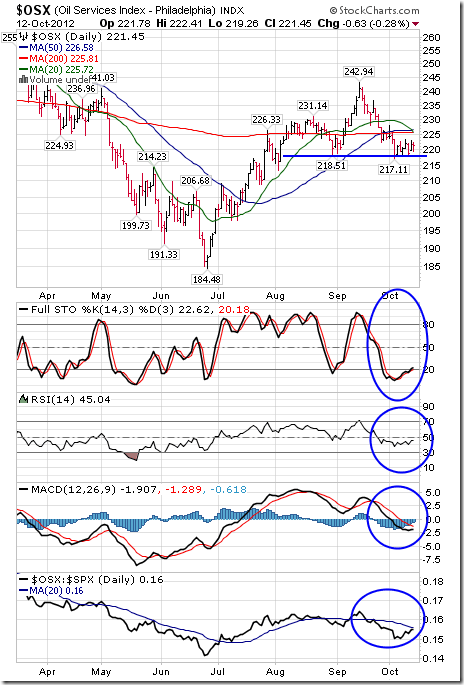
The Philadelphia Oil Services Index added 1.48 points (0.67%) last week. Intermediate trend is neutral. Support has formed at 217.11. Resistance is at 242.94. Short term momentum indicators are trending down. Stochastics already are oversold. Strength relative to the S&P 500 Index is negative, but showing early signs of change.
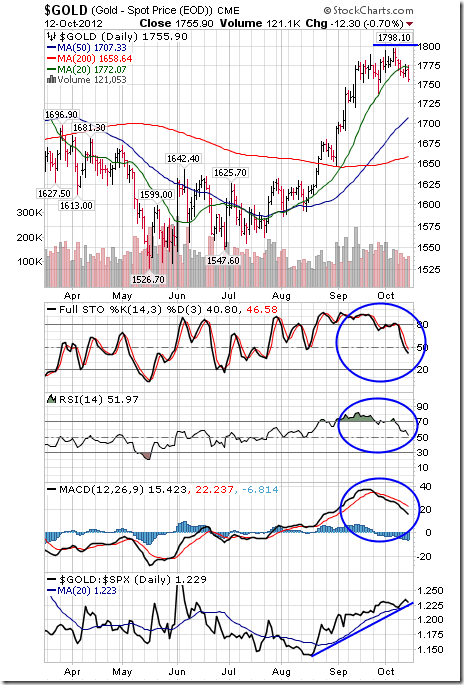
Gold lost $29.05 per ounce (1.63%) last week. Intermediate trend is up. Resistance is forming at $1,798.10 per ounce. Gold remains above its 50 and 200 day moving averages, but fell below its 20 day moving average last week. Short term momentum indicators are trending down. Strength relative to the S&P 500 Index is positive, but showing early signs of change. Historically, the month of October has been the weakest month of the year for gold.
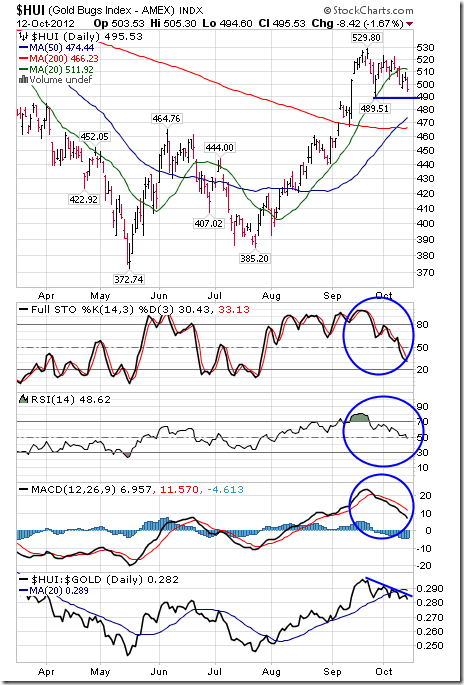
The AMEX Gold Bug Index fell 18.40 points (3.58%) last week. Intermediate trend is up. Resistance has formed at 529.80. Support is at 489.51. The Index remains above its 50 and 200 day moving averages, but fell below its 20 day moving average. Short term momentum indicators are trending down. Strength relative to gold has turned negative.
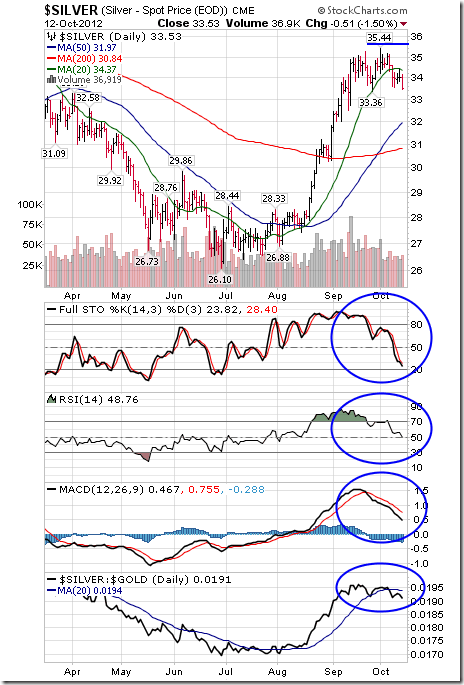
Silver fell $1.07 per ounce (3.09%) last week. Intermediate trend is up. Resistance is at $35.44 and support is at $33.36. Silver remains above its 50 and 200 day moving averages, but fell below its 20 day moving average. Short term momentum indicators are trending down. Strength relative to gold has turned slightly negative.
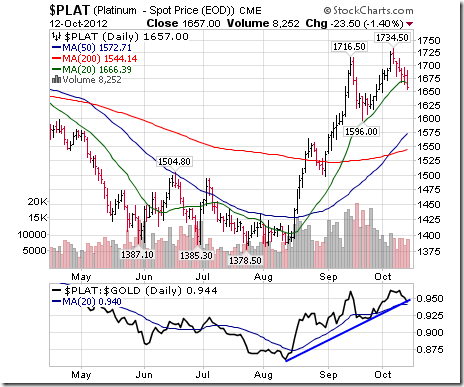
Platinum fell $57.00 per ounce (3.33%) last week. Platinum fell below its 20 day moving average on Friday. Strength relative to gold is positive, but showing signs of change.
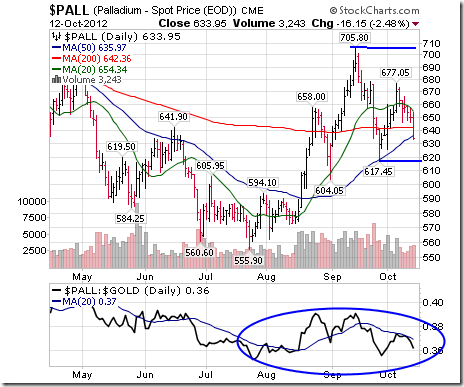
Palladium dropped $29.05 per ounce (4.38%) last week. Palladium fell below its 50 and 200 day moving averages on Friday. Strength relative to gold is neutral, but showing signs of change.
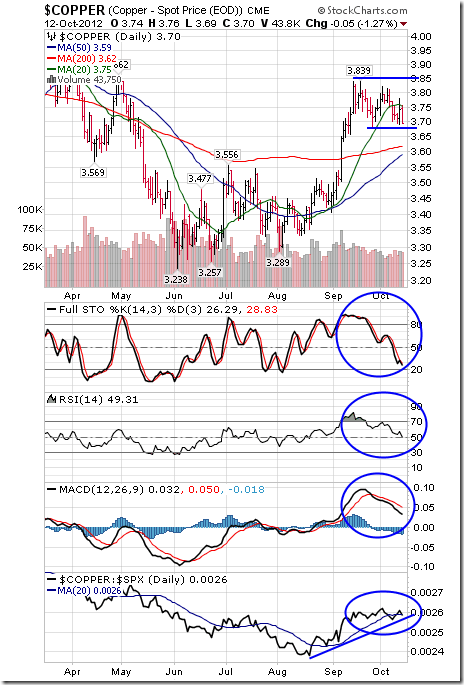
Copper slipped $0.07 (1.86%) last week. Intermediate trend is up. Support is at $3.6805. Resistance is at $3.839. Copper remains above its 50 and 200 day moving averages and below its 20 day moving average. Short term momentum indicators are trending down. Strength relative to the S&P 500 Index has been positive, but is showing early signs of change.
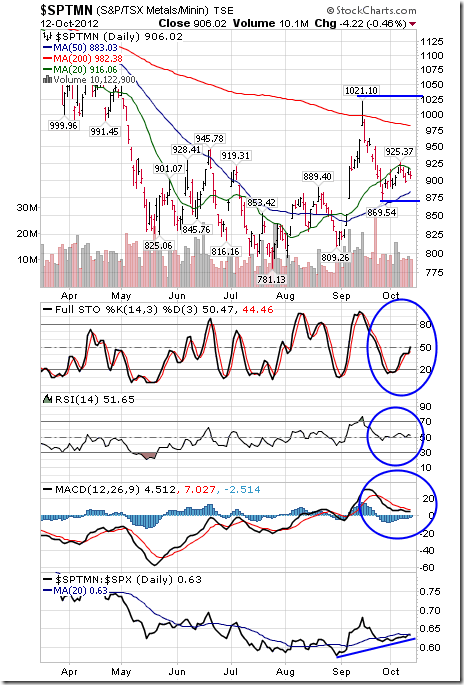
The TSX Global Metals and Mining Index fell 8.85 points (0.97%) last week. Intermediate trend is up. Support is at 869.54. The Index remains above its 50 day moving average and below its 20 and 200 day moving averages. Short term momentum indicators have recovered to a neutral level. Strength relative to the S&P 500 Index is neutral, but showing early signs of turning positive.
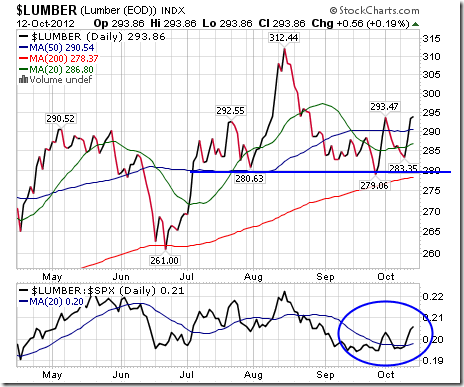
Lumber added $7.53 (2.63%) last week. Intermediate trend is up. Lumber moved above its 20 and 50 day moving averages. Strength relative to the S&P 500 Index has turned positive.
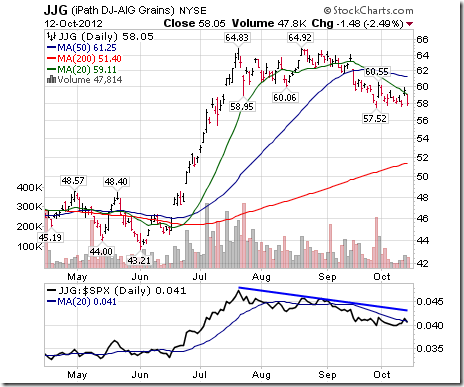
The Grain ETN slipped $0.28 (0.48%) last week. Intermediate trend is down. Support has formed at $57.52. Units trade below their 20, 50 and 200 day moving averages. Strength relative to the S&P 500 Index remains negative, but is showing early signs of change.
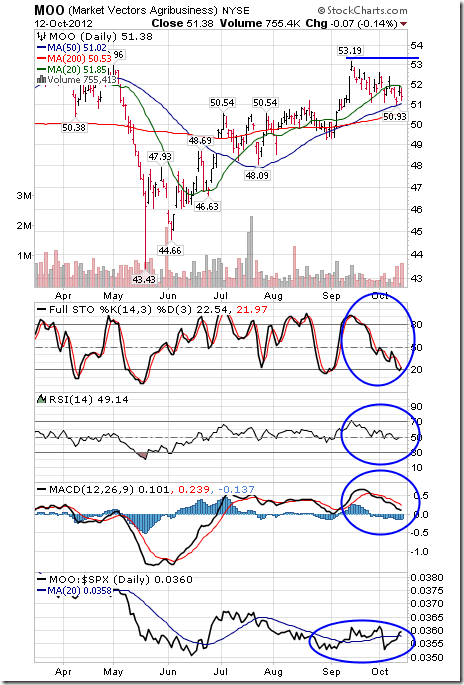
The Agriculture ETF eased $0.51 points (0.98%) last week. Intermediate trend is up. Resistance is at $53.19. Units remain above their 50 and 200 day moving averages, but fell below its 20 day moving average. Short term momentum indicators are trending down. Stochastics already are oversold, but have yet to show signs of bottoming. Strength relative to the S&P 500 Index has returned to neutral.
Interest Rates
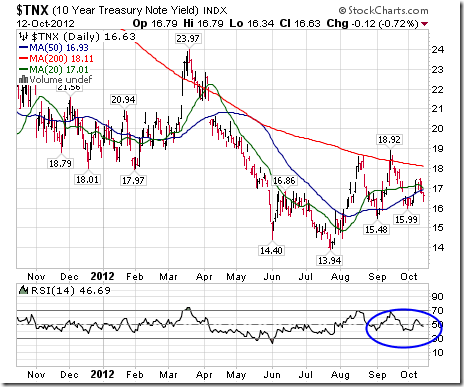
The yield on 10 year Treasuries fell 6.9 basis points (3.99%) last week. Short term momentum indicators remain neutral.
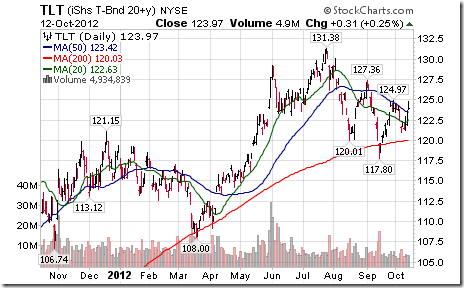
Conversely, price of the long term Treasury ETF added $2.83 (2.34%) last week.
Other Issues
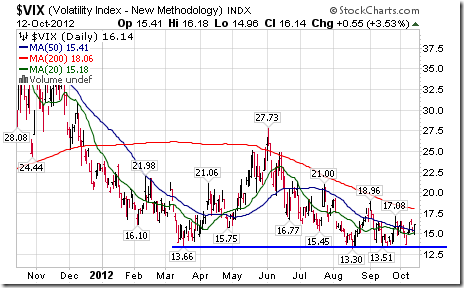
The VIX Index added 1.81 (12.63%) last week. The Index bounced from long term support near 13.5%.
Third quarter earnings report become a focus this week. Most of the important reports coming this week are from financial and technology sectors. Reports released last week (Alcoa, Safeway, JP Morgan, Wells Fargo were given a rough response despite earnings that exceeded consensus. Not a good sign! Consensus for S&P 500 companies is for a year-over-year decline of 2.6%. Of greater importance, fourth quarter guidance will have an influence. Currently, analysts are estimating a 10% year-over-year earnings gain in the fourth quarter. Consensus estimates clearly are too high.
Short and intermediate technical indicators continue to trend down.
Economic news generally is expected to be favourable this week (Retail sales, Empire State, Industrial Production, Capacity Utilization, Housing Starts, Philadelphia Fed, Leading Indicators). However, economic news last week also was positive and equity markets failed to respond.
North American equity markets have a history of moving higher prior to a U.S. presidential election when the market figures out who will win. Current polls suggest a dead heat, implying that uncertainties remain. The second Presidential candidate debate on Tuesday could have an influence.
Macro events outside of North America will have an impact on equity markets this week. In Europe the focus is on the Europe Summit on Thursday and Friday. Financial rescue plans for Spain, Greece and Cyprus are on the schedule. China released an encouraging trade surplus report on Saturday implying that third quarter GDP and August Industrial Production to be released on Thursday could show signs of stabilization in growth near a 7.5% annual rate.
Cash positions held by corporations and individuals are huge and growing. Cash positions will start to be employed when the next President is determined and the Fiscal Cliff is resolved.
The Bottom Line
The entry point for the seasonal trade in North American equity markets (on average during the past 61 years: October 28th) is rapidly approaching. The expected short term correction from mid-September has happened, but has yet to show signs of bottoming. Watch short term technical indicators for signs of an intermediate bottom. Sectors to consider include due to their favourable seasonality starting by the end of October include technology, agriculture, forest products, transportation, industrials, steel, consumer discretionary and China.
Special Free Services available through www.equityclock.com
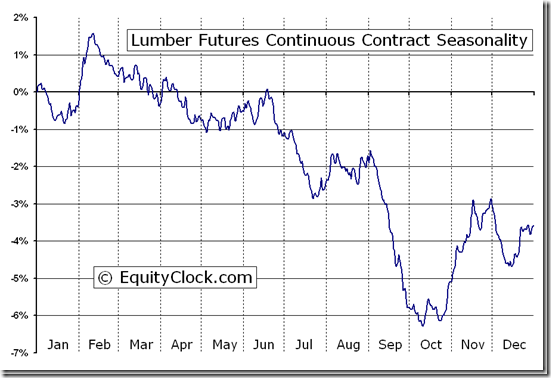
Equityclock.com is offering free access to a data base showing seasonal studies on individual stocks and sectors. The data base holds seasonality studies on over 1000 big and moderate cap securities and indices.
To login, simply go to http://www.equityclock.com/charts/
Following is an example:
Lumber Futures (LB) Seasonal Chart
The latest weekly update on ETFs in Canada to October 13th is available at
Tom Rogers’ Weekly Elliott Wave Blog
Following is a link:
http://www.tomrogers.net/signpost.htm
FP Trading Desk Headline
FP Trading Desk headline reads, “Why you should buy U.S. stocks”. Following is a link to the report:
http://business.financialpost.com/2012/10/12/why-you-should-buy-u-s-stocks/
Disclaimer: Comments and opinions offered in this report at www.timingthemarket.ca are for information only. They should not be considered as advice to purchase or to sell mentioned securities. Data offered in this report is believed to be accurate, but is not guaranteed.
Don and Jon Vialoux are research analysts for Horizons Investment Management Inc. All of the views expressed herein are the personal views of the authors and are not necessarily the views of Horizons Investment Management Inc., although any of the recommendations found herein may be reflected in positions or transactions in the various client portfolios managed by Horizons Investment Management Inc
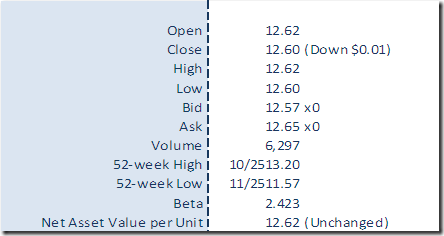
Horizons Seasonal Rotation ETF HAC October 12th 2012


