Upcoming US Events for Today:
- Challenger Job Cuts for September will be released at 7:30am.
- Weekly Jobless Claims will be released at 8:30am. The market expects Initial Claims to show 370K versus 359K previous. Continuing Claims are expected to reveal 3273K versus 3271K previous.
- Factory Orders for August will be released at 10:00am. The market expects a decline of 6.0% versus a gain of 2.8% previous.
- Minutes from the latest FOMC Meeting will be released at 2:00pm.
- Chain Store Sales for September will be released throughout the day.
Upcoming International Events for Today:
- Bank of England Rate Decision will be released at 7:00am EST. The market expects no change at 0.50%.
- The ECB Rate Decision will be released at 7:45am EST. The market expects no change at 0.75%.
- Canadian Ivey PMI for September will be released at 10:00am EST. The market expects 59.4 versus 62.5 previous.
The Markets
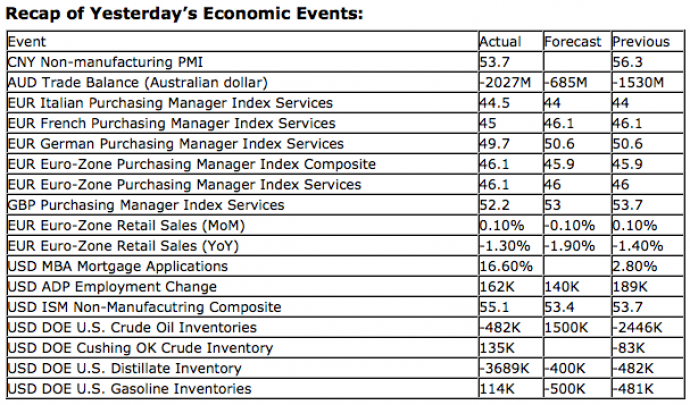
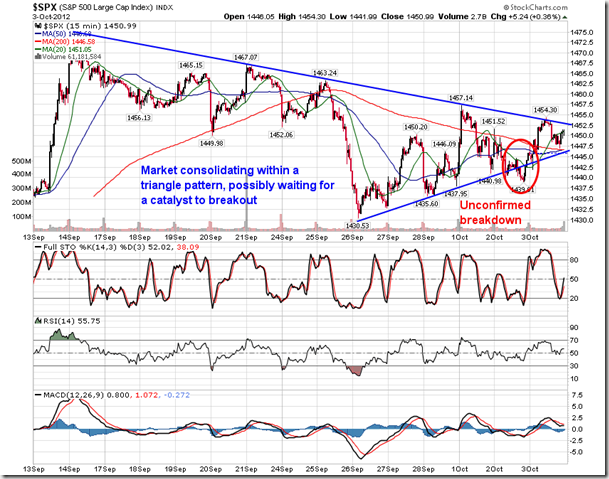
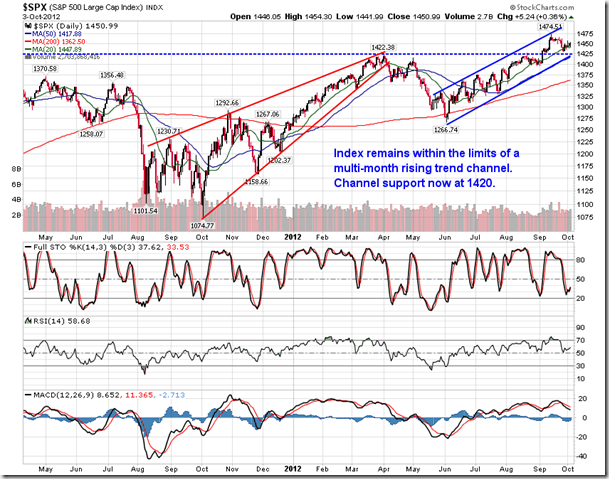
Markets pushed higher on Wednesday following favourable reports pertaining to employment and the service sector. ADP reported that private payrolls rose by 162,000 in September, beating estimates of 140,000. As well, a report on the services sector showed gains for the month of September as new orders jumped to one of the strongest levels since March. ISM Services reported a stronger than expected 55.1, beating estimates of 53.5. The reports gave lift to stocks as investors shifted focus toward domestic fundamentals and away from Euro-zone debt concerns. The S&P 500 remained within the almost 3 week old triangle pattern, although equity futures at the time of writing are implying a breakout from this zone as early as Thursday, potentially bringing to an end this period of consolidation.
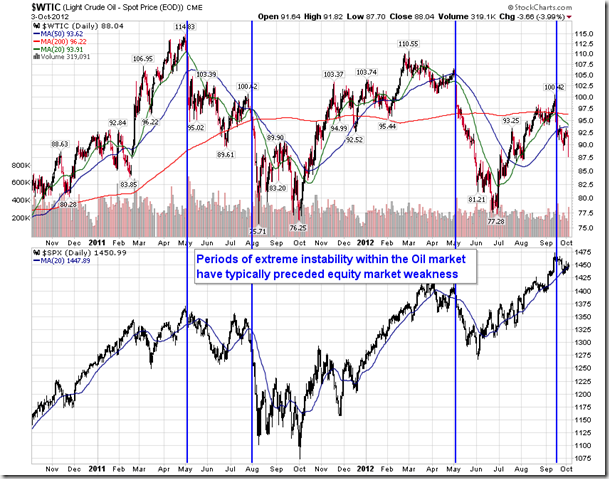
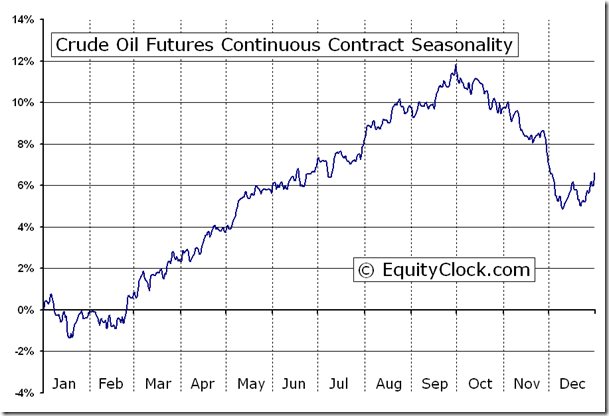
Although the headline equity benchmark numbers finished in the green, underlying weakness remained evident. Oil showed extreme destabilization following a report that was bearish for the commodity. According to Bloomberg, “crude output rose 11,000 barrels a day to 6.52 million last week, the most since December 1996, while total fuel demand fell 0.3 percent to 18.3 million barrels a day in the four weeks ended Sept. 28, the lowest level since April.” The suggestion of increased supply and decreased demand sent the commodity lower by 4% as investors shed bullish bets. Shares of Energy companies were negatively impacted as a result, making it the worst performing sector during Wednesday’s session. Extreme instability within the Oil market has been known to precede equity market weakness as investors are forced to sell assets in order to cover margin calls and raise cash, a scenario that cannot be ruled out this time as well. Oil is presently within a period of seasonal weakness that runs through to December now that summer driving season has come to an end and hurricane season nears conclusion in November. Note the lower significant high in the price of Oil at the September peak compared to peaks of previous years. The fact that recent price action could not overcome resistance derived from previous peaks is a bearish mark for the commodity. Significant support can be found around $77, a break of which would set the stage for a long-term decline, potentially leading to a retest of levels last seen in 2009.
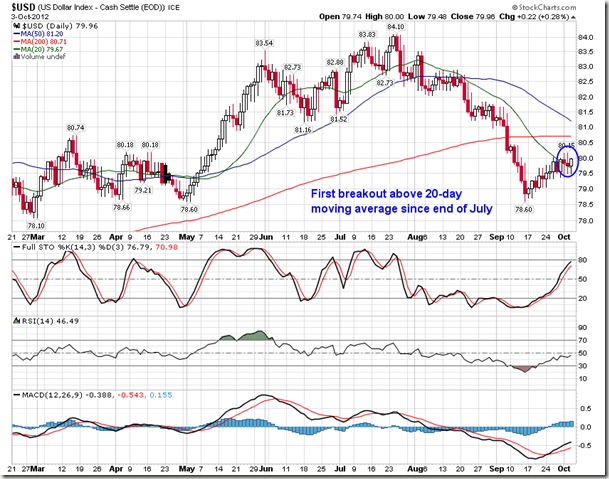
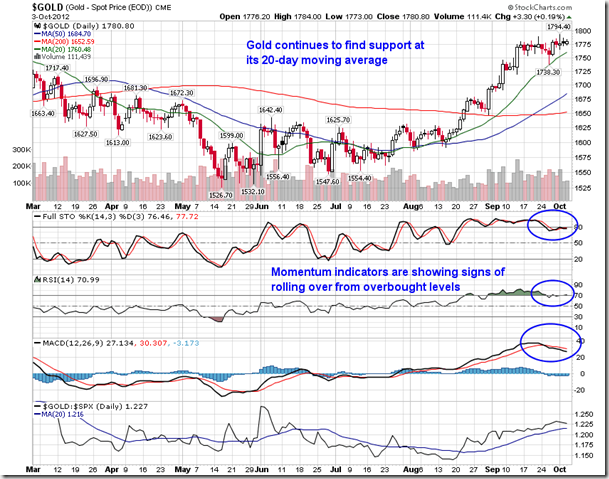
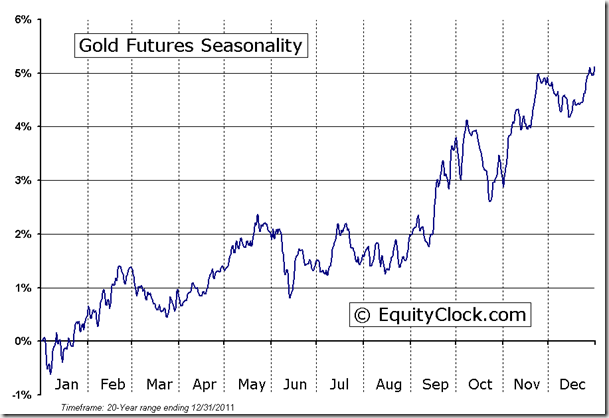
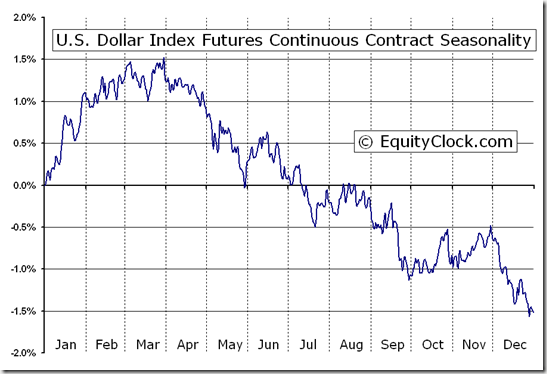
As Oil sold off, investors ran to the safety of the US Dollar and, to a small degree, Gold. Both saw gains on the session with the US Dollar opening and closing above its 20-day moving average for the first time since the end of July, just prior to ECB President Mario Draghi presenting his “Save the Euro” speech. The US Dollar remains a key risk-off trade, primarily deriving value from the movement of the Euro as investors express their satisfaction of the debt situation within the region. Dollar strength could equate to further commodity weakness into the month of October, a scenario that is seasonally typical as the dollar realizes flat to positive tendencies through the month of November. Gold reaches an average seasonal peak within the first 10 days of October. Momentum indicators for the metal have already started to roll over, hinting of the seasonal peak that is common for this time of year. The metal resumes a positive path through the end of the year, although returns are typically less than equities over the same time period.
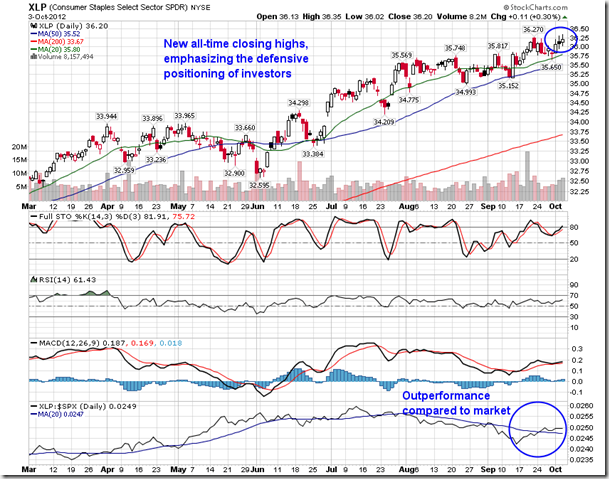
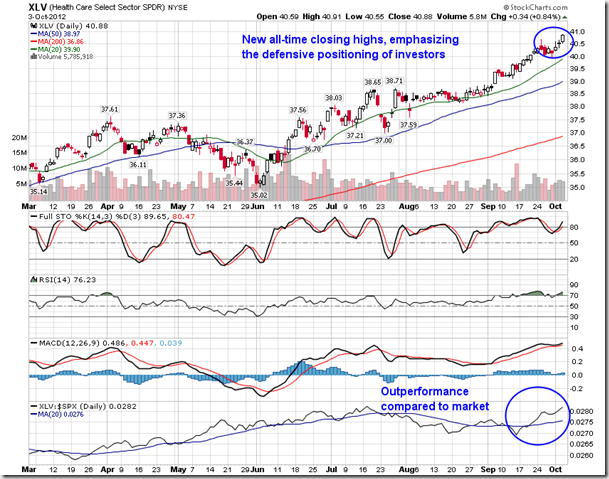
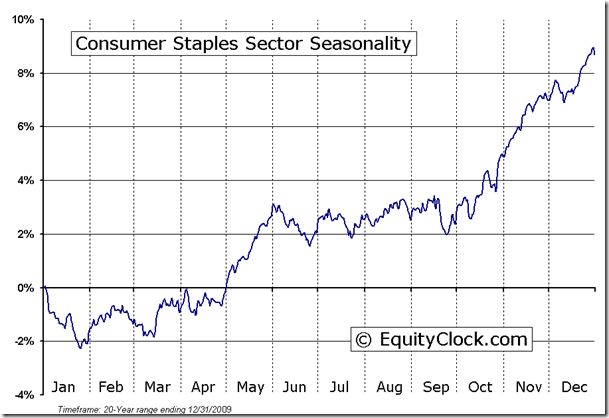
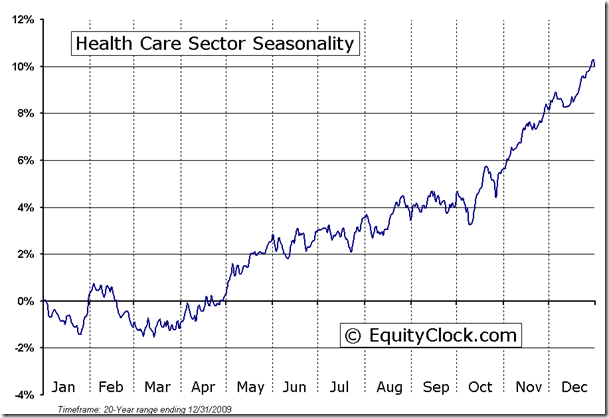
As mentioned, energy was the weakest sector during Wednesday’s session, exacerbating a trend of underperformance within cyclical sectors as of recent. And as cyclicals continued to show signs of struggle, defensives continued to strengthen with the Health Care ETF (XLV) and Consumer Staples ETF (XLP) closing at the highest levels in the history of the products. Staples and Health Care have outperformed the market since mid-September as investors accumulate lower beta assets while waiting for a resolution to some key overhanging issues, such as the Spanish debt situation and the presidential election. Health Care and Consumer staples tend to perform well through the fourth quarter as investors maintain defensive exposure until the start of the new year.
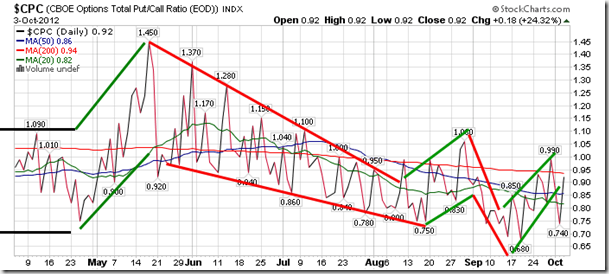
Sentiment on Thursday, as gauged by the put-call ratio, ended bullish at 0.92. The ratio has jumped around over the past couple of days as investors place bets pertaining to a breakout or breakdown from the present consolidation range within equity markets.
Chart Courtesy of StockCharts.com
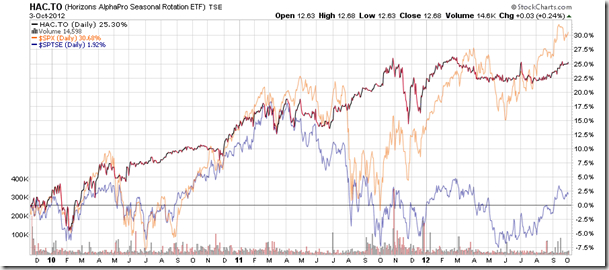
Chart Courtesy of StockCharts.com
Horizons Seasonal Rotation ETF (TSX:HAC)
- Closing Market Value: $12.68 (up 0.24%)
- Closing NAV/Unit: $12.66 (down 0.02%)
Performance*
| 2012 Year-to-Date | Since Inception (Nov 19, 2009) | |
| HAC.TO | 3.97% | 26.6% |
* performance calculated on Closing NAV/Unit as provided by custodian
Click Here to learn more about the proprietary, seasonal rotation investment strategy developed by research analysts Don Vialoux, Brooke Thackray, and Jon Vialoux.


