


To give you a sense of how much the demand for physical gold has increased over the past decade, we’ve listed a select number of physical gold buyers and calculated their net change in annual demand in tonnes from 2000 to 2012 (see Chart A).
CHART A
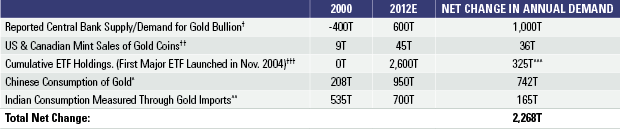
Numbers quoted in metric tonnes.
† Source: CBGA1, CBGA2, CBGA3, International Monetary Fund Statistics, Sprott Estimates.
†† Source: Royal Canadian Mint and United States Mint.
††† Includes closed-end funds such as Sprott Physical Gold Trust and Central Fund of Canada.
^ Source: World Gold Council, Sprott Estimates.
^^ Source: World Gold Council, Sprott Estimates.
^^^ Refers to annualized increase over the past eight years.
As can be seen, the mere combination of only five separate sources of demand results in a 2,268 tonne net change in physical demand for gold over the past twelve years – meaning that there is roughly 2,268 tonnes of new annual demand today that didn’t exist 12 years ago. According to the CPM Group, one of the main purveyors of gold statistics, the total annual gold supply is estimated to be roughly 3,700 tonnes of gold this year. Of that, the World Gold Council estimates that only 2,687 tonnes are expected to come from actual mine production, while the rest is attributed to recycled scrap gold, mainly from old jewelry.5 (See footnote 5). The reporting agencies have a tendency to insist that total physical demand perfectly matches physical supply every year, and use the “Net Private Investment” as a plug to shore up the difference between the demand they attribute to industry, jewelry and ‘official transactions’ by central banks versus their annual supply estimate (which is relatively verifiable). Their “Net Private Investment” figures are implied, however, and do not measure the actual investment demand purchases that take place every year. If more accurate data was ever incorporated into their market summary for demand, it would reveal a huge discrepancy, with the demand side vastly exceeding their estimation of annual supply. In fact, we know it would exceed it based purely on China’s Hong Kong gold imports, which are now up to 458 tonnes year-to-date as of July, representing a 367% increase over its purchases during the same period last year. If the imports continue at their current rate, China will reach 785 tonnes of gold imports by year-end. That’s 785 tonnes in a market that’s only expected to produce roughly 2,700 tonnes of mine supply, and that’s just one buyer.
Then there are all the private buyers whose purchases go unreported and unacknowledged, like that of Greenlight Capital, the hedge fund managed by David Einhorn, that is reported to have purchased $500 million worth of physical gold starting in 2009. Or the $1 billion of physical gold purchased by the University of Texas Investment Management Co. in April 2011… or the myriad of other private investors (like Saudi Sheiks, Russian billionaires, this writer, probably many of our readers, etc.) who have purchased physical gold for their accounts over the past decade. None of these private purchases are ever considered in the research agencies’ summaries for investment demand, and yet these are real purchases of physical gold, not ETF’s or gold ‘certificates’. They require real, physical gold bars to be delivered to the buyer. So once we acknowledge how big the discrepancy is between the actual true level of physical gold demand versus the annual “supply”, the obvious questions present themselves: who are the sellers delivering the gold to match the enormous increase in physical demand? What entities are releasing physical gold onto the market without reporting it? Where is all the gold coming from?
There is only one possible candidate: the Western central banks. It may very well be that a large portion of physical gold currently flowing to new buyers is actually coming from the Western central banks themselves. They are the only holders of physical gold who are capable of supplying gold in a quantity and manner that cannot be readily tracked. They are also the very entities whose actions have driven investors back into gold in the first place. Gold is, after all, a hedge against their collective irresponsibility – and they have showcased their capacity in that regard quite enthusiastically over the past decade, especially since 2008.
If the Western central banks are indeed leasing out their physical reserves, they would not actually have to disclose the specific amounts of gold that leave their respective vaults. According to a document on the European Central Bank’s (ECB) website regarding the statistical treatment of the Eurosystem’s International Reserves, current reporting guidelines do not require central banks to differentiate between gold owned outright versus gold lent out or swapped with another party. The document states that, “reversible transactions in gold do not have any effect on the level of monetary gold regardless of the type of transaction (i.e. gold swaps, repos, deposits or loans), in line with the recommendations contained in the IMF guidelines.”6 (Emphasis theirs). Under current reporting guidelines, therefore, central banks are permitted to continue carrying the entry of physical gold on their balance sheet even if they’ve swapped it or lent it out entirely. You can see this in the way Western central banks refer to their gold reserves. The UK Government, for example, refers to its gold allocation as, “Gold (incl. gold swapped or on loan)”. That’s the verbatim phrase they use in their official statement. Same goes for the US Treasury and the ECB, which report their gold holdings as “Gold (including gold deposits and, if appropriate, gold swapped)” and “Gold (including gold deposits and gold swapped)”, respectively (see Chart B).


