by Don Vialoux, Timingthemarket.ca
Upcoming US Events for Today:
- ADP Employment Change for September will be released at 8:15am. The market expects 140K versus 201K previous.
- The ISM Services Index for September will be released at 10:00am. The market expects 53.5 versus 53.7 previous.
- Weekly Crude Inventories will be released at 10:30am.
Upcoming International Events for Today:
- German PMI Services for September will be released at 3:55am EST. The market expects 50.6 versus 48.3 previous.
- Euro-Zone PMI Services for September will be released at 4:00am EST. The market expects 46.0 versus 47.2 previous.
- Great Britain PMI Services for September will be released at 4:30am EST. The market expects 53.0 versus 53.7 previous.
- Euro-Zone Retail Sales for August will be released at 5:00am EST. The market expects a year-over-year decline of 2.0% versus a decline of 1.7% previous.
The Markets
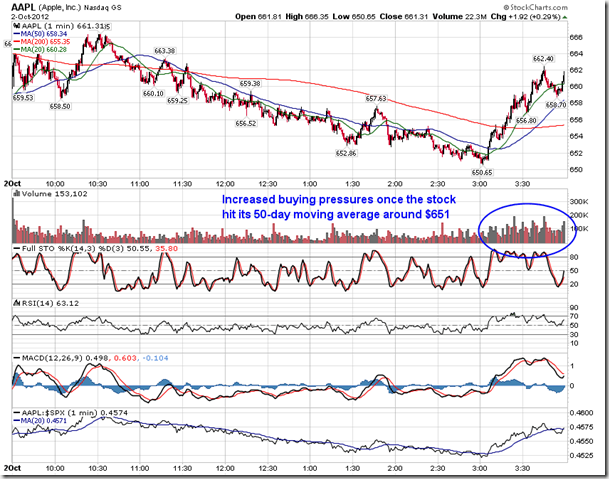
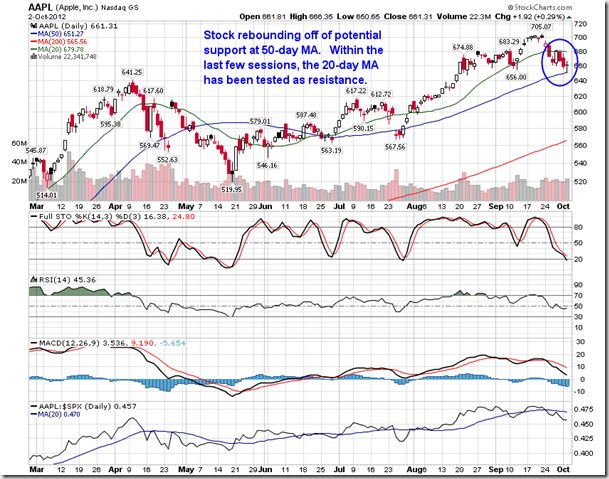
Markets traded around the flat-line on Tuesday as investors continue to wait for news pertaining to a potential bailout of Spain as well as an update of the employment condition in the US. The ADP employment report is due out today, followed by the important monthly employment report on Friday, among the last major economic reports before the presidential election, which takes place in just over one month’s time. Apple played an influential role in the Tuesday’s market activity, yet again. The stock fell by as much as 1.3% at the session low before touching it’s 50-day moving average line at $650, initiating a flurry of buying pressures at this important technical level. As Apple rebounded, so too did the market. Of course Apple is one of the most important stocks for investors as not only is it the the largest single security weight within a number of benchmarks, but it is also one of the most widely held securities in the stock market. Any opportunity to accumulate the stock during periods of weakness, it is likely that investors will pursue it. Momentum indicators for Apple are increasingly becoming bearish now that the stock has reached oversold levels with regards to Stochastics. Expect escalated selling pressures should the 50-day moving average fail to hold as support, implying that escalated negative pressures would also be felt within broad equity benchmarks.
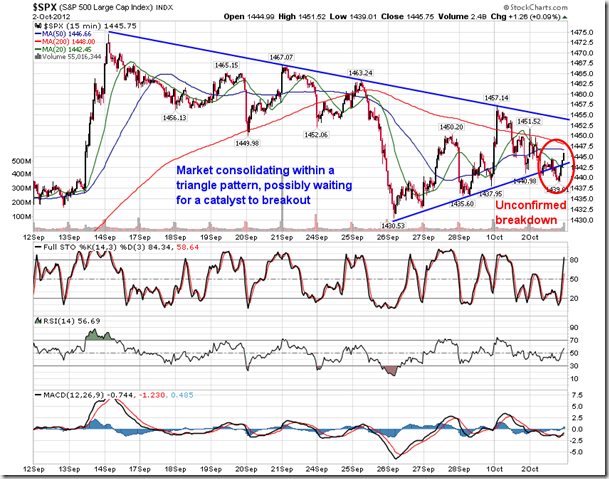
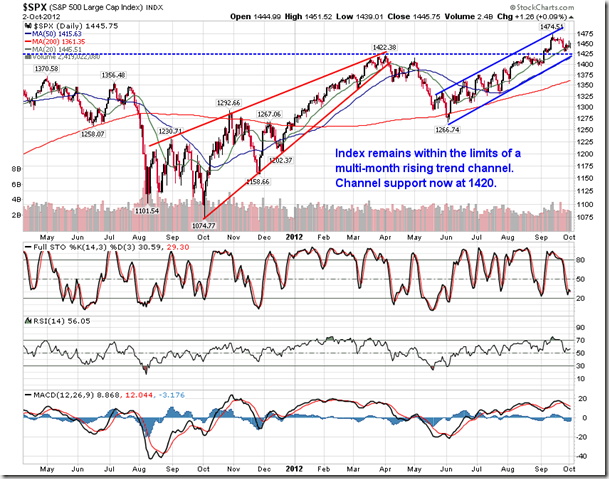
Just a quick update to a chart posted yesterday of the 15 minute activity of the S&P 500. The index briefly broke down below the previously mentioned triangle pattern, trading back within the range by the closing bell. This pattern remains key to watch as it is presently the battleground for the intermediate-term trend.
A definitive breakout above resistance just under 1455 could set the stage of the next leg of the bull market rally. A breakdown below support around 1445 could likely sway undecided investors to take their profits and stand aside until clarity from earnings and the election (among other things) is provided.
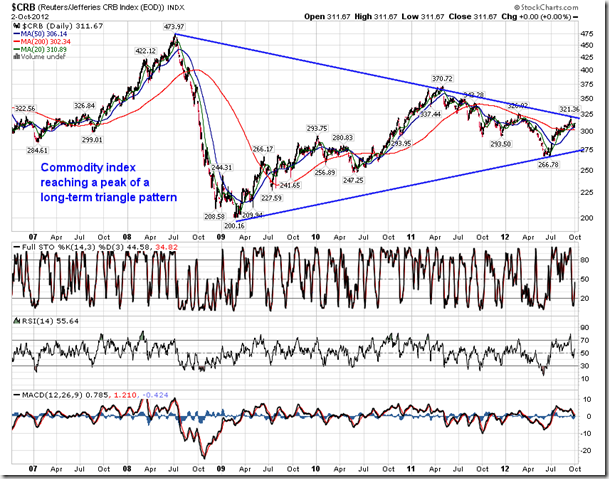
The chart of the S&P 500 doesn’t hold the only triangle pattern out there.
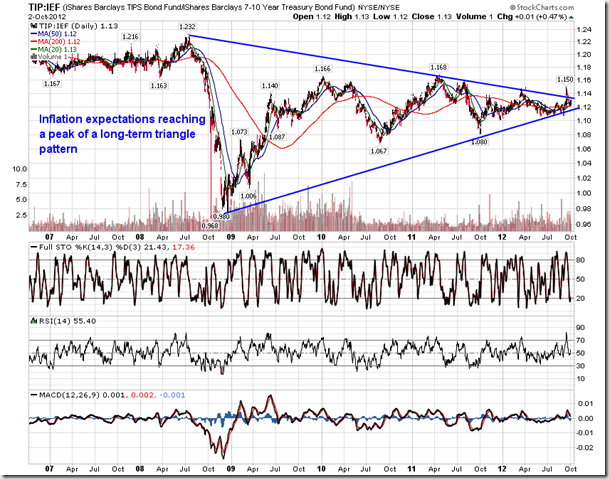
The long-term charts of the CRB commodity index and the ratio chart of the TIPS Bond Fund (TIP) versus the 7-10 Year Treasury Bond Fund (IEF), an appropriate measure of inflation, shows that the price action of each is reaching a critical point within a triangle pattern. A break in either direction will define the next major trend for commodities and inflation, likely influencing equity and bond markets in the process.
Obviously, with US enacting easy money policy for an indefinite period or time and other central banks seeming very accommodative as well, the bias is to the upside, but a breakout is still required in order to confirm.
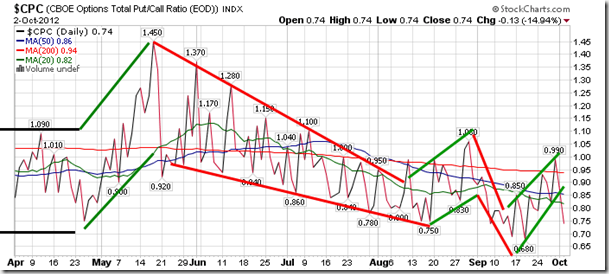
Sentiment on Tuesday, according to the put-call ratio, ended overly bullish at 0.74. The ratio continues to suggest complacency amongst investors given the uncertainties within the market. Employment reports offered through the remainder of the week will likely provide indication of whether this complacency is warranted.
Chart Courtesy of StockCharts.com
Chart Courtesy of StockCharts.com
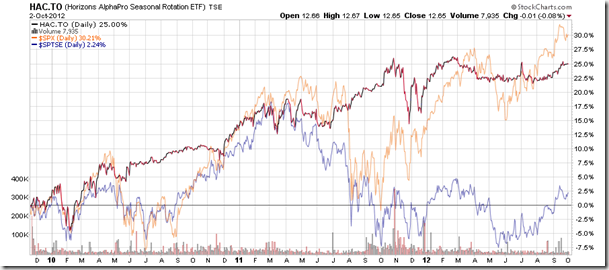
Horizons Seasonal Rotation ETF (TSX:HAC)
- Closing Market Value: $12.65 (down 0.08%)
- Closing NAV/Unit: $12.67 (down 0.04%)
Performance*
| 2012 Year-to-Date | Since Inception (Nov 19, 2009) | |
| HAC.TO | 4.02% | 26.7% |
* performance calculated on Closing NAV/Unit as provided by custodian
Click Here to learn more about the proprietary, seasonal rotation investment strategy developed by research analysts Don Vialoux, Brooke Thackray, and Jon Vialoux.
Copyright © Timingthemarket.ca


