by Don Vialoux, Timingthemarket.ca
Upcoming US Events for Today:
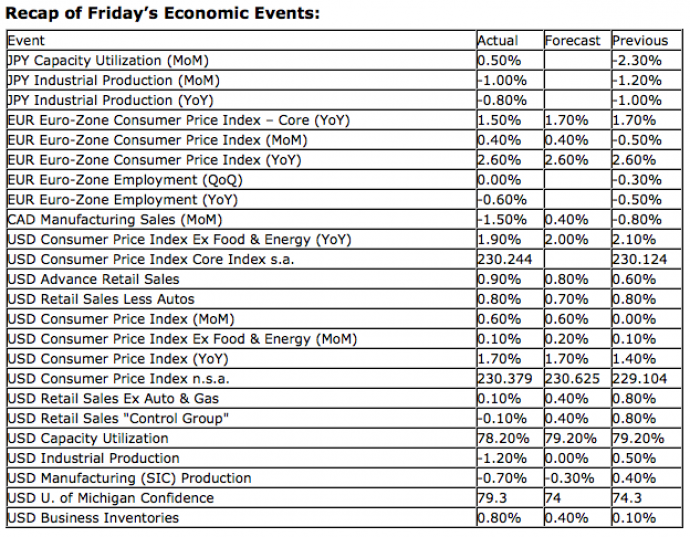
- The Empire Manufacturing Survey for September will be released at 8:30am. The market expects –2.00 versus –5.85 previous.
Upcoming International Events for Today:
- The Reserve Bank of Australia Board Minutes for September will be released at 9:30pm EST.
The Markets
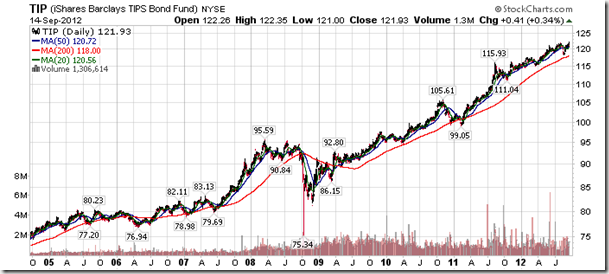
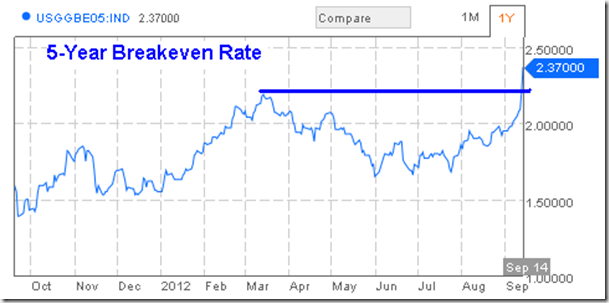
Markets edged higher on Friday, still buoyed by the euphoria that was created following the Fed’s announcement of a new quantitative easing program on Thursday. Equities and commodities have received a significant boost over the past two sessions as inflation expectations jump. The Treasury Inflation Protected ETF (TIP) is trading at the highest level since inception of the fund. The US Five Year Breakeven rate at around 2.37% has set new year-to-date highs and is reaching towards the highest levels since the recession began. And the recent PPI and CPI reports showed the largest month over month increase since the first half of 2009. The statement from the FOMC on Thursday noted that “the Committee anticipates that inflation over the medium term likely would run at or below its 2-percent objective.” It’s safe to say that the Fed’s primary mandate of price stability is under threat. As inflation creeps higher, the cost of goods will encompass a greater portion of the income of consumers, threatening discretionary purchases at a very crucial time in the calendar year, the Christmas season. The end result of this additional stimulus package could prove to be more detrimental to the economy, and in turn employment, should the trend inflation continue. Remember, effects of inflation are immediate while employment and wage increases that could potentially will result take much longer to be realized, which makes the threat of a poor fourth quarter that much more real. Oil prices on Friday shot up above $100 a barrel for the first time since the beginning of May and according to an article published at Zerohedge.com “for the first time in history, national average gas prices for the 2nd week of September were over $4.00.” Food prices are already creeping higher as a result of the summer’s drought and now metal prices are breaking out. Decreased purchasing power is not exactly the economic boost that the Fed desires.
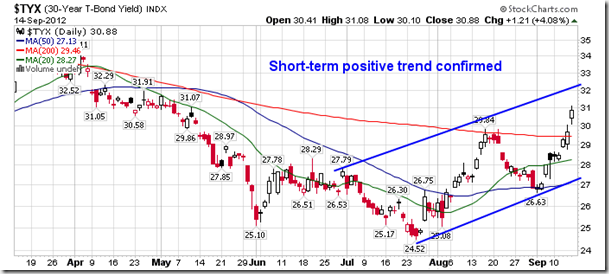
Higher inflation expectations are also proving to be detrimental to bond yields. The yield on the 30-year treasury bond broke out above resistance on Friday as investors seek a higher real rate of return. The short-term trend of bond yields has confirmed a positive trend, acting in opposition to the Fed’s desire to keep interest rates low. The Fed stated on Thursday that their action “should put downward pressure on longer term interest rates, support mortgage markets, and to help make broader financial conditions more accommodative.” The Fed could be in serious trouble.
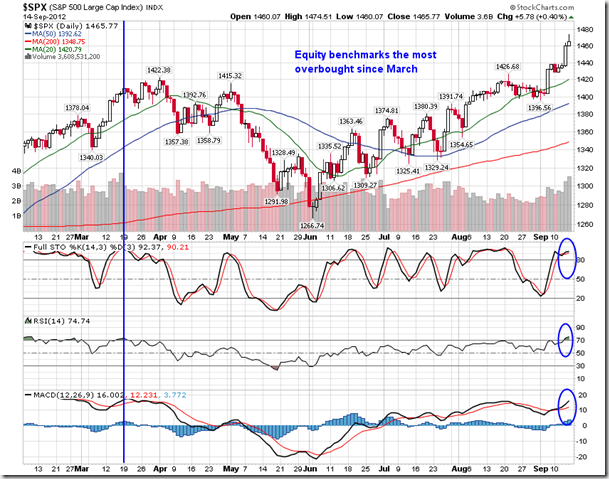
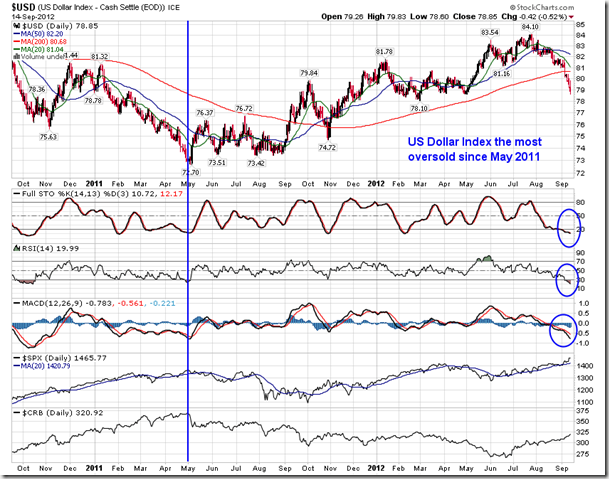
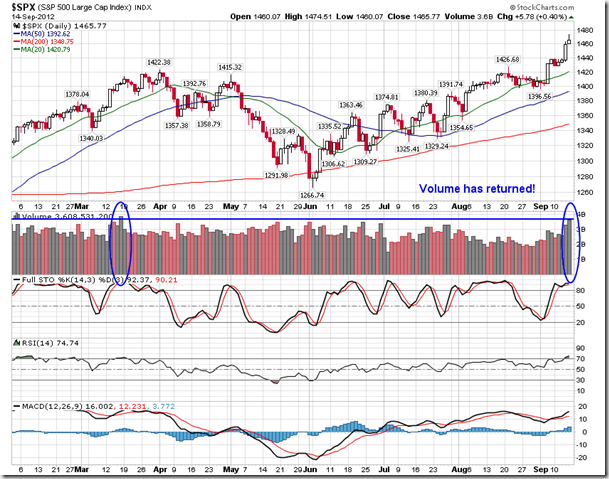
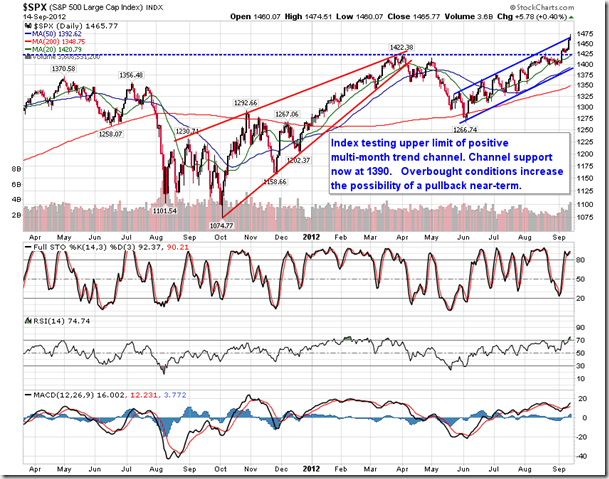
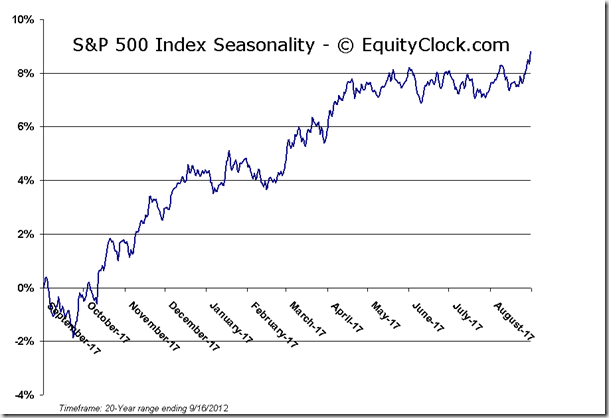
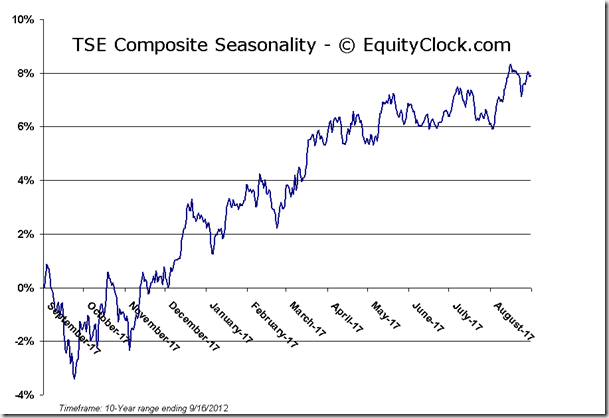
Fortunately, for equity and commodity investors, prices are moving higher as the US dollar becomes devalued. Equity benchmarks, such as the S&P 500 Index, are now the most stretched to the upside since the middle of March this year, just prior to the the Spring pullback. Technical indicators, such as stochastics and RSI, are firmly within overbought territory, which could lead to buyer exhaustion as marginal buyers fail to find value within the markets. Conversely, the US Dollar is extremely stretched to the downside, presently the most oversold since May of 2011. The currency bottomed shortly thereafter that year, placing pressure on equity and commodity markets for the months to follow. The degree to which these asset classes are stretched increases the probability of a near-term pullback, likely to correspond to the seasonal weakness in equity markets that runs into the month of October. Area of support for the S&P 500 upon a pullback falls between a range bound by the 50-day moving average, presently at 1392, and the 20-day moving average, presently at 1420. Conversely, resistance for the US Dollar index runs back to the recent breakdown point at 81. Each of these levels would be logical points to retest to confirm the breakout in equities and the breakdown in the Dollar, ideally alleviating stretched technical indicators and replenishing upside momentum into the end of the year.
Overall, despite near-term expectations of a pullback, the trend in equity markets remains firmly positive. Technical Sell signals have evaded equity markets since the start of June, warranting a hold mentality, even through the recent uncertainties.
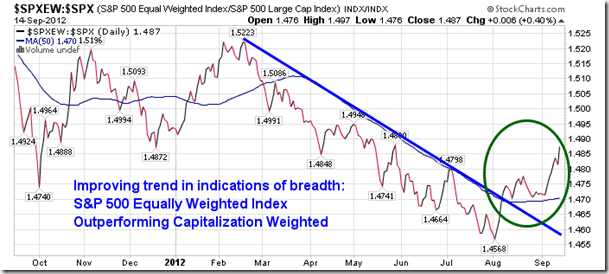
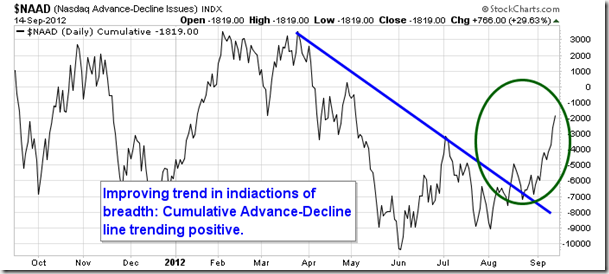
Breadth is showing considerable signs of improving after spending much of the summer within a declining trend. The S&P 500 Equally Weighted index is now outperforming the capitalization weighted index. And the NASDAQ cumulative advance decline line is starting to trend positive after a summer full of declines.
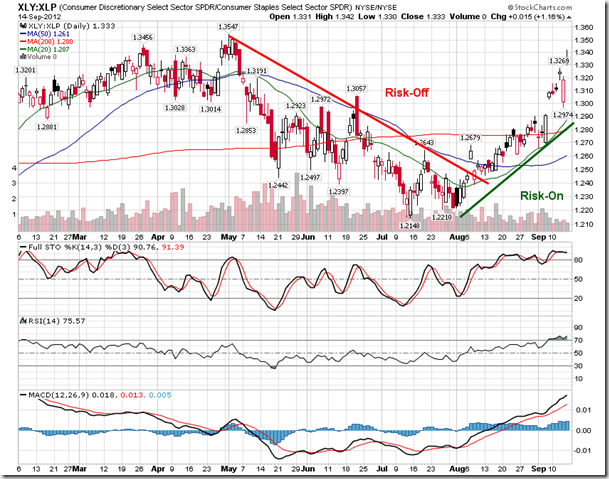
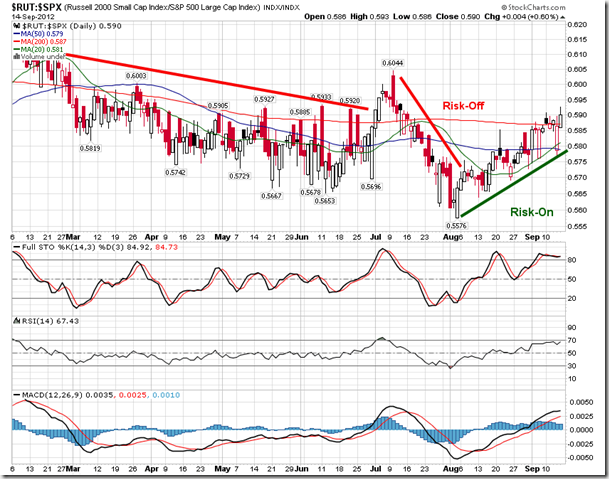
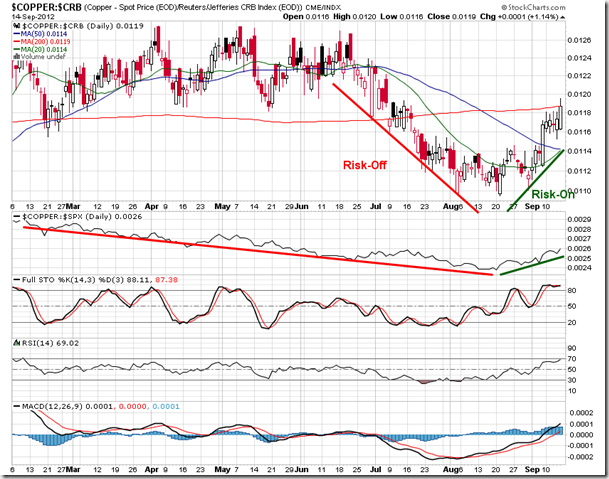
Risk sentiment has rebounded. Cyclicals are outperforming defensives, a characteristic of a bullish market. Riskier small cap stocks are outperforming lower beta large caps. And Copper (also known as Doctor Copper due to its predictive capabilities of market direction) is starting to outperform equity benchmarks as well as commodity benchmarks.
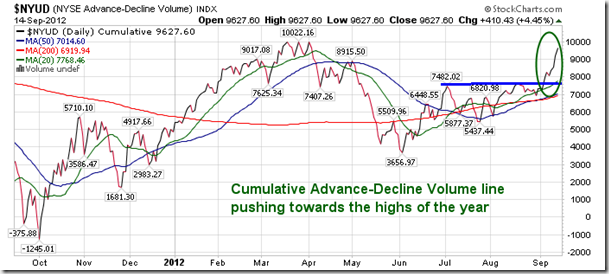
Volume has also returned to equity markets with Friday showing the largest volume day for the S&P 500 since the middle of March. The Cumulative NYSE Advance-Decline Volume line for the NYSE is pushing towards the highs of the year having broken out above a level of resistance within the last couple of weeks.
Each of these bullish characteristics gives no reason to suspect the positive trend in equity markets will end anytime soon, despite any short-term weakness. A significant negative catalyst would be required to derail the present positive trend. Economic fundamentals, although negatively diverging from equity prices, are not yet proving to be a risk to the trend. Increased inflation expectations and a devaluation of the US Dollar is likely to keep a bid in equities and commodities through year-end, driving equities higher during the seasonally strong fourth quarter. Next hurdle for the markets to contend with is earnings, which could initiate short-term concern, allowing equity markets to pullback between now and mid-October. FedEx and Oracle, two economic bellwethers, will report earnings this week.
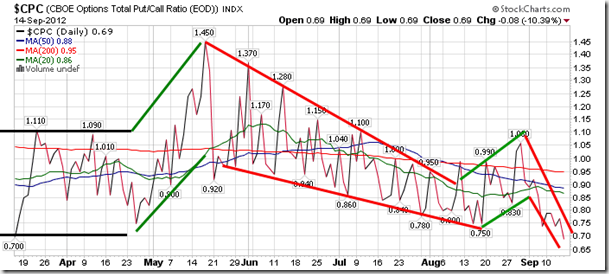
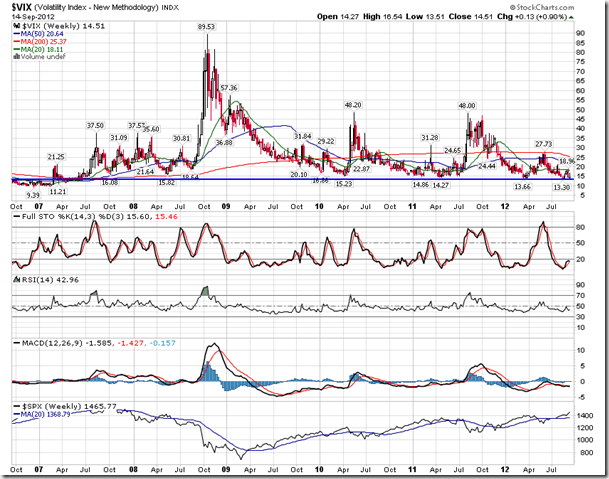
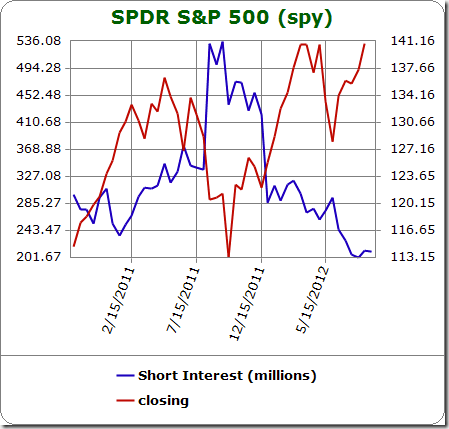
Sentiment on Friday, as gauged by the put-call ratio, ended overly bullish at 0.69. This is the lowest level since the days prior to the 2011 plunge in equity markets during the month of August. The ratio is screaming complacency, a typical precursor to equity market declines. The VIX is also rebounding off of a long-term level of support, also a leading indicator of equity market weakness ahead. And the short Interest in the S&P 500 ETF (SPY) is holding around the lowest levels in years. Equity investors are presently underexposed to protective positions and overly exposed to risk assets, tipping the boat too far in one direction. A pullback is required to correct the uneven tilt.
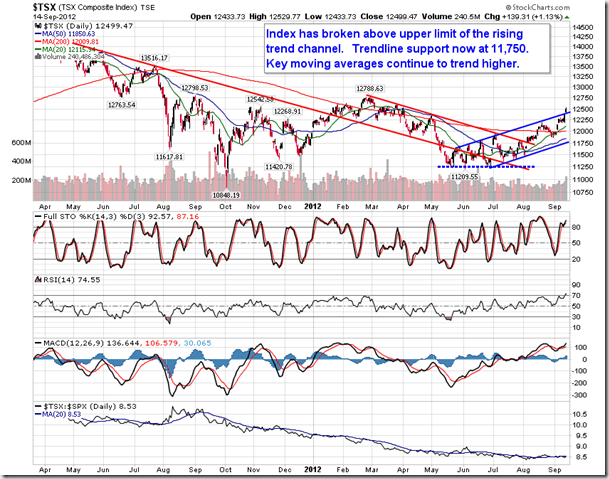
Chart Courtesy of StockCharts.com
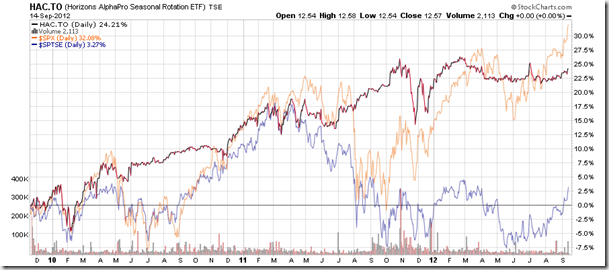
Chart Courtesy of StockCharts.com
Horizons Seasonal Rotation ETF (TSX:HAC)
- Closing Market Value: $12.57 (unchanged)
- Closing NAV/Unit: $12.58 (up 0.11%)
Performance*
| 2012 Year-to-Date | Since Inception (Nov 19, 2009) | |
| HAC.TO | 3.29% | 25.8% |
* performance calculated on Closing NAV/Unit as provided by custodian
Click Here to learn more about the proprietary, seasonal rotation investment strategy developed by research analysts Don Vialoux, Brooke Thackray, and Jon Vialoux.


