(Editor’s Note: Next Tech Talk report is available on Friday September 14th. Don Vialoux is presenting at the CSTA International Commodity Conference in Banff).
Economic News This Week
July U.S. Trade Deficit to be released at 8:30 AM EDT on Tuesday is expected to increase to $44.5 billion from $42.9 billion.
The FOMC Meeting rate decision is released at 12:30 PM EDT on Thursday. Press conference is held at 2:15 PM.
Weekly Initial Jobless Claims to be released at 8:30 AM EDT on Thursday is expected to increase to 370, 000 from 365,000 last week.
August Producer Prices to be released at 8:30 AM EDT on Thursday are expected to increase 1.0% versus a gain of 0.3% in July. Excluding food and energy, PPI is expected to increase 0.2% versus a gain of 0.4% in July.
August Retail Sales to be released at 8:30 AM EDT on Friday are expected to increase 0.6% versus a gain of 0.8% in July. Ex autos, Retail Sales are expected to increase 0.5% versus a gain of 0.8% in July.
August Consumer Prices to be released at 8:30 AM EDT on Friday are expected to increase 0.5% versus no change in July. Excluding food and energy, CPI is expected to increase 0.2% versus a gain of 0.1% in July.
August U.S. Industrial Production to be released at 9:15 AM EDT on Friday is expected to increase 0.2% from a gain of 0.7% in July. August Capacity Utilization is expected to remain the same at 79.3%.
September U.S. Michigan Consumer Sentiment Index to be released at 9:55 AM EDT on Friday is expected to slip to 74.0 from 74.3 in August.
July Business Inventories to be released at 10:00 AM EDT on Friday are expected to increase 0.3% versus a gain of 0.l% in June.
Earnings Reports This Week
No major companies are scheduled to release earnings.
Equity Trends
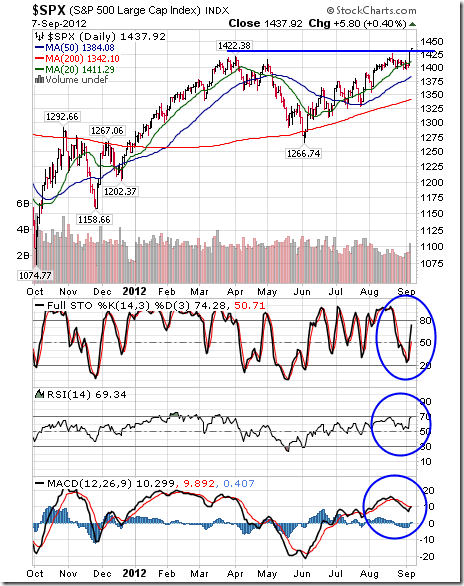
The S&P 500 Index gained 26.79 points (1.90%) last week. Intermediate trend is up. The Index broke above resistance at 1,426.68 to reach a four year high. The Index remains above its 50 and 200 day moving averages and moved above its 20 day moving average. Short term momentum indicators have rebounded to overbought levels.
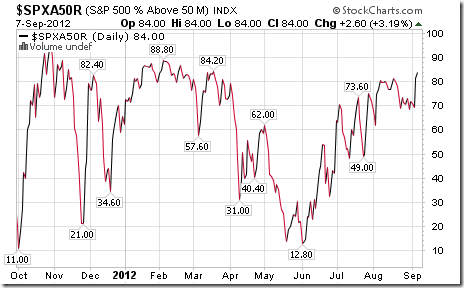
Percent of S&P 500 stocks trading above their 50 day moving average advanced to 84.00% last week from 71.60%. Percent has returned to an intermediate overbought level.
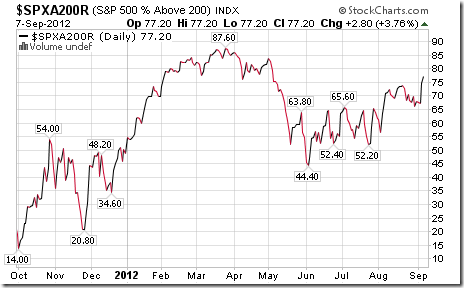
Percent of S&P 500 stocks trading above their 200 day moving average increased last week to 77.20% from 67.80%. Percent has returned to an intermediate overbought level.
The ratio of S&P 500 stocks in an uptrend to a downtrend (i.e. the Up/Down ratio) jumped last week to (328/96=) 3.42 from 2.26. The ratio remains intermediate overbought.
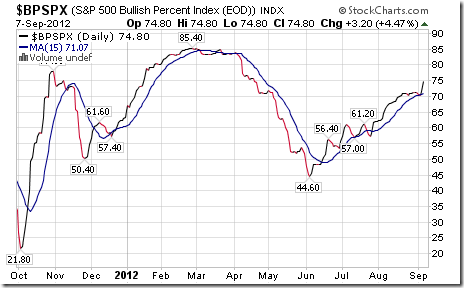
Bullish Percent Index for the S&P 500 Index increased last week to 74.80% from 71.20% and remained above its 15 day moving average. The Index remains intermediate overbought.
The Up/Down ratio for TSX Composite stocks increased last week to (155/65=) 2.36 from1.86. The ratio is intermediate overbought.
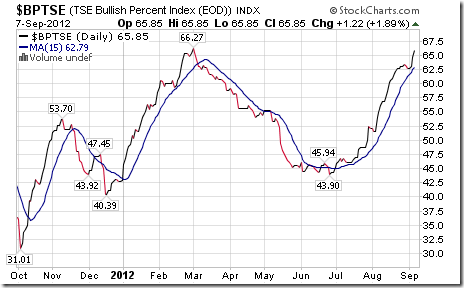
Bullish Percent Index for TSX Composite stocks increased last week to 65.85% from 62.20% and remained above its 15 day moving average. The Index remains intermediate overbought.
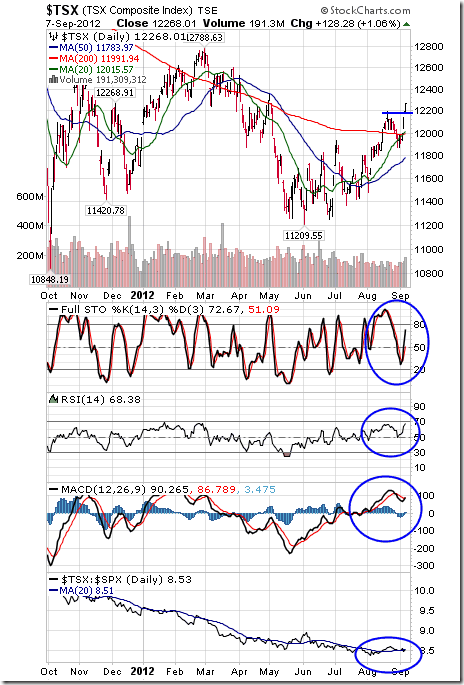
The TSX Composite Index added 185.78 points (1.54%) last week. Intermediate trend is up. The Index broke above resistance at 12,196.77 on Friday. The Index remains above its 50 day moving average and moved above its 20 and 200 day moving averages last week. Short term momentum indicators have recovered to overbought levels. Strength relative to the S&P 500 Index has changed from negative to at least neutral.
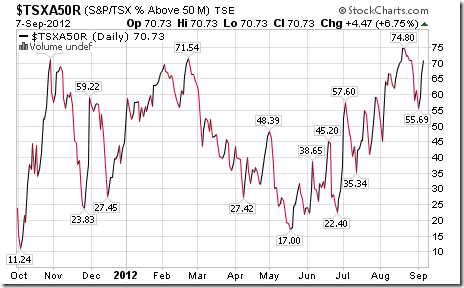
Percent of TSX stocks trading above their 50 day moving average increased last week to 70.73% from 61.38%. Percent has returned to an intermediate overbought level.
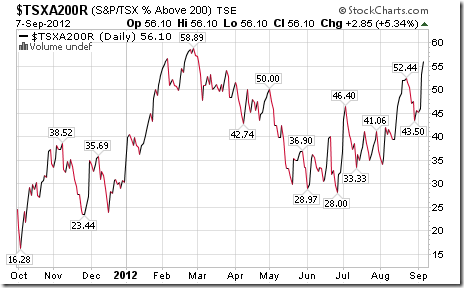
Percent of TSX stocks trading above their 200 day moving average increased last week to 56.10% from 45.53%. Percent has returned to an intermediate overbought level.
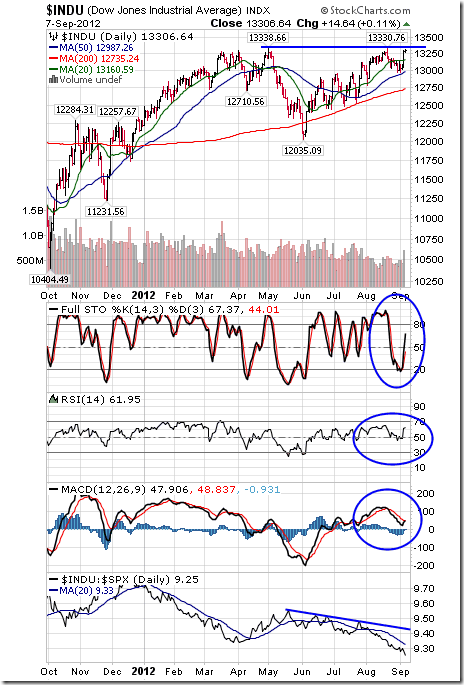
The Dow Jones Industrial Average gained 148.67 points (1.13%) last week. Intermediate trend is up. The Average is testing resistance at 13,330.76 and 13,306.64. The Average remains above its 50 and 200 day moving averages and moved above its 20 day moving average on Thursday. Short term momentum indicators have returned to overbought levels. Strength relative to the S&P 500 Index remains negative.
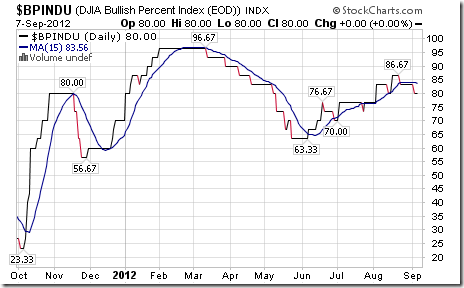
Bullish Percent Index for Dow Jones Industrial Average stocks slipped last week to 80.00% from 83.33% and remained below its 15 day moving average. The Index is intermediate overbought and showing early signs of rolling over.
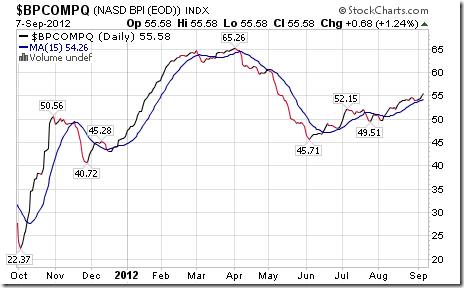
Bullish Percent for NASDAQ Composite stocks increased last week to 55.58% from 53.94% and remained above its 15 day moving average. The Index remains intermediate overbought.
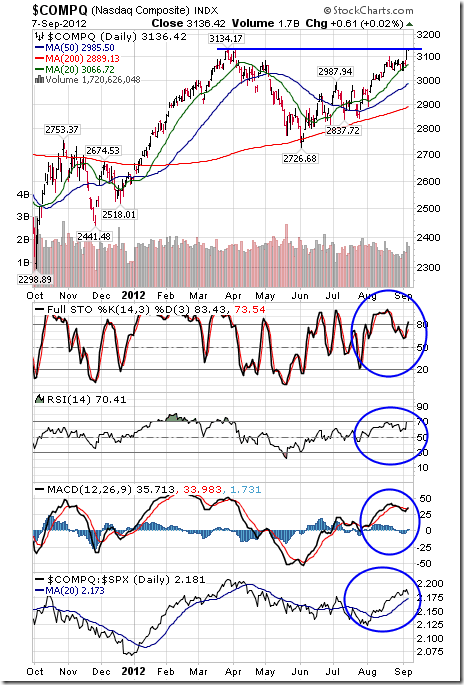
The NASDAQ Composite Index gained 66.63 points (2.17%) last week. Intermediate trend is up. The Index broke resistance at 3,134.17 on Friday to reach an 11 year high. The Index remains above its 20, 50 and 200 day moving averages. Short term momentum indicators have returned to overbought levels. Strength relative to the S&P 500 Index remains positive.
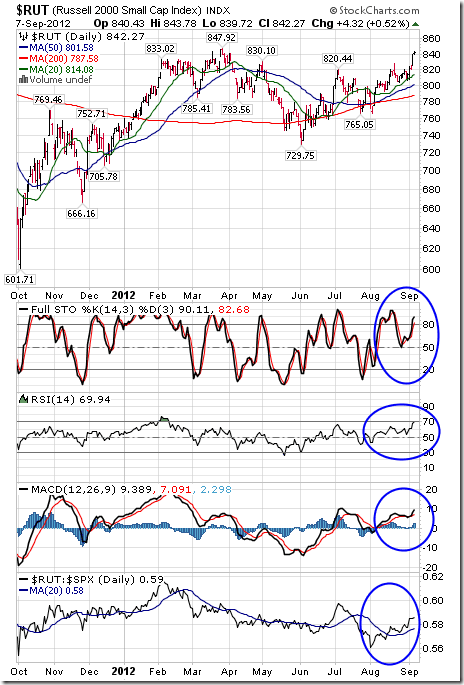
The Russell 2000 Index added 33.08 points (4.09%) last week. Intermediate trend is up. Resistance at 846.92 is being tested. The Index remains above its 20, 50 and 200 day moving averages. Short term momentum indicators have returned to overbought levels. Strength relative to the S&P 500 Index remains positive.
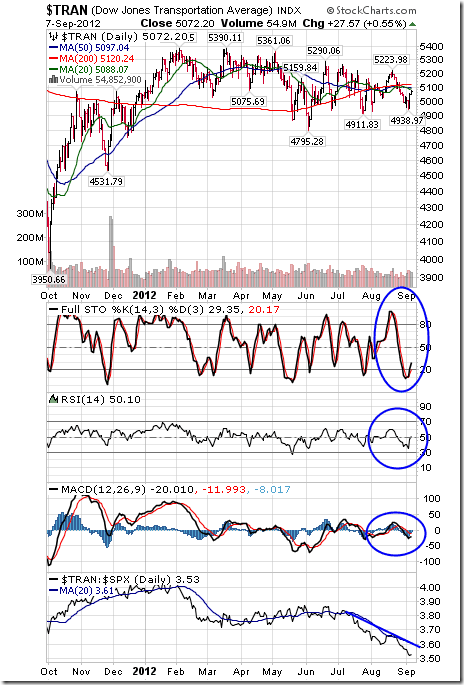
The Dow Jones Transportation Average fell 46.38 points (0.91%) last week. Intermediate trend is down. Resistance is at 5,223.98 and support is at 4,911.83 and 4,795.28. The Average remains below its 20, 50 and 200 day moving averages. Short term momentum indicators are neutral. Strength relative to the S&P 500 Index remains negative.
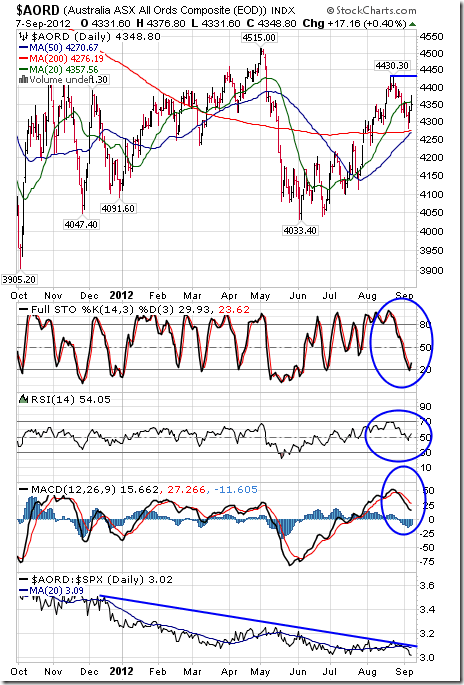
The Australia All Ordinaries Composite Index slipped 27.70 points (0.63%) last week. Intermediate trend is down. The Index remains below its 20 day moving average and above its 50 and 200 day moving averages. Short term momentum indicators are trending down. Strength relative to the S&P 500 Index has returned to negative from neutral.
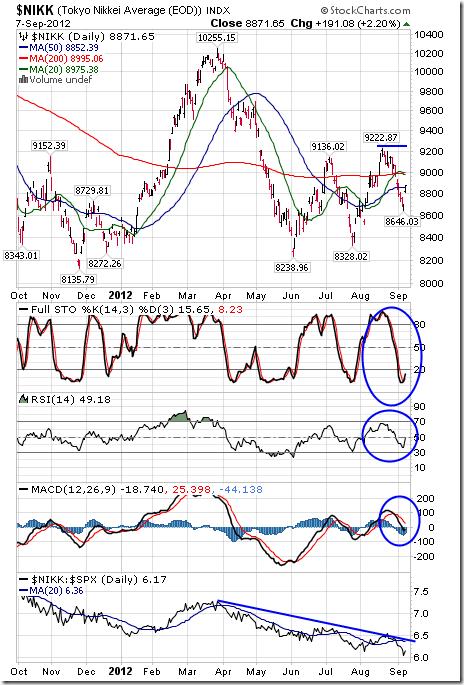
The Nikkei Average fell 199.11 points (2.20%) last week. Intermediate trend is up. The Average fell below its 20 and 200 day moving averages, but recovered on Friday to above its 20 day moving averages. Short term momentum indicators are trending down. Strength relative to the S&P 500 Index has returned to negative.
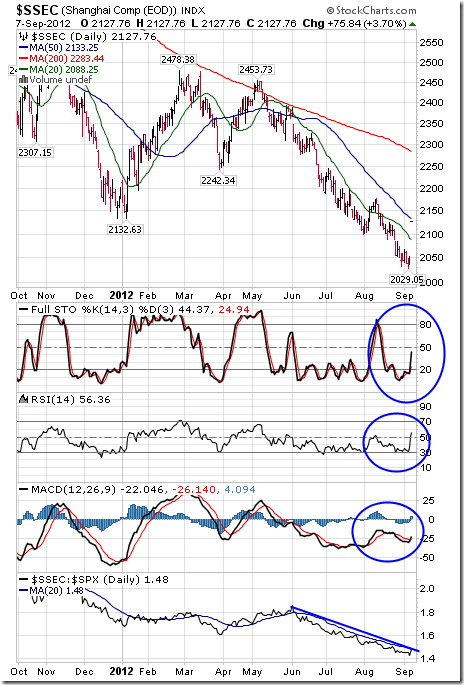
The Shanghai Composite Index gained 35.66 points (1.70%) last week. Intermediate trend is down despite a 3.70% gain on Friday following announcement of a fiscal stimulation program. The Index remains below its 20, 50 and 200 day moving averages. Short term momentum indicators are recovering from oversold levels. Strength relative to the S&P 500 Index remains negative.
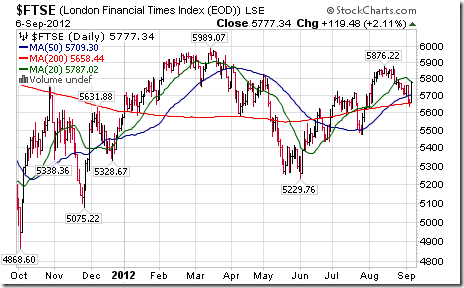
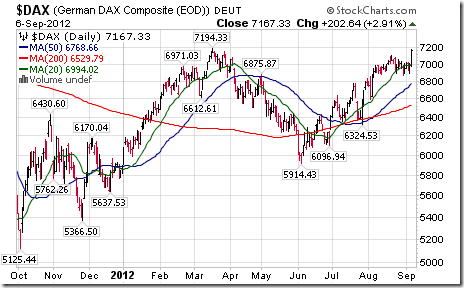
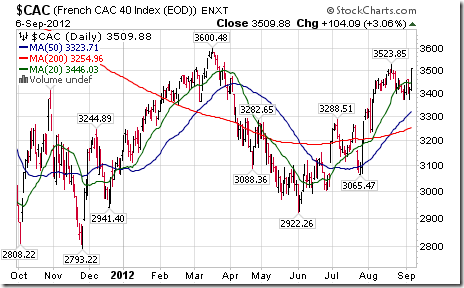
The London FT Index added 0.74 (0.01%) last week, the Frankfurt DAX Index gained 217.76 points (3.13%) and the Paris CAC Index added 77.32 points (2.25%) last week.
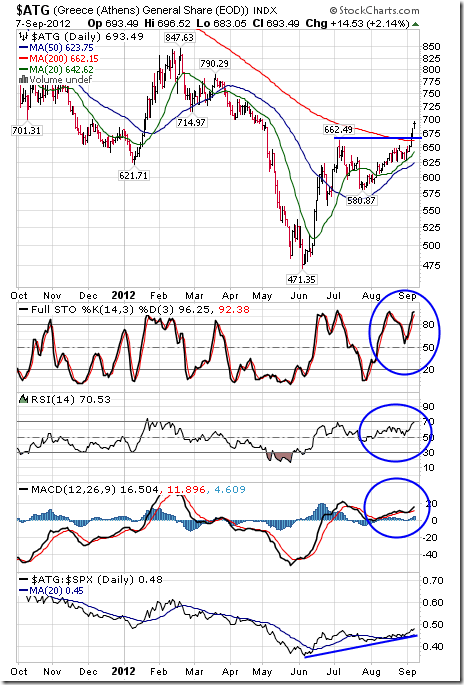
The Athens Index gained 49.45 points (7.68%) last week on hopes that Draghi’s plan to stabilize European sovereign debt rates will work. Intermediate trend changed from down to up on a break above resistance at 662.49/ The Index remained above its 20 and 50 day moving average and broke above its 200 day moving average last Thursday. Short term momentum indicators are overbought, but have yet to show signs of peaking. Strength relative to the S&P 500 Index has turned from neutral to positive.
Currencies
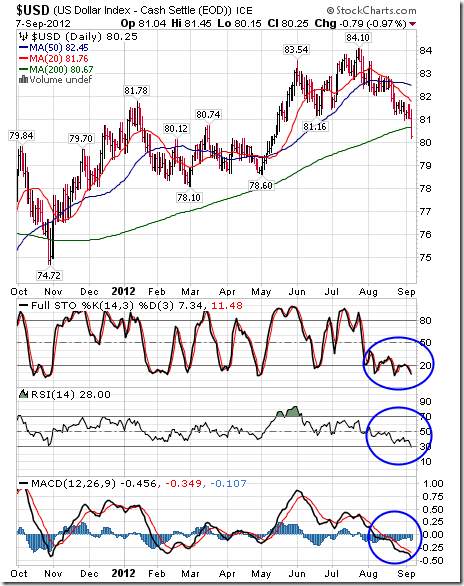
The U.S. Dollar Index fell another 1.38 (1.37%) last week with most of the loss occurring on Friday following release of the August employment report. The Index remains below its 20 and 50 day moving averages and dropped below its 200 day moving average on Friday. Short term momentum indicators are oversold, but have yet to show signs of bottoming.
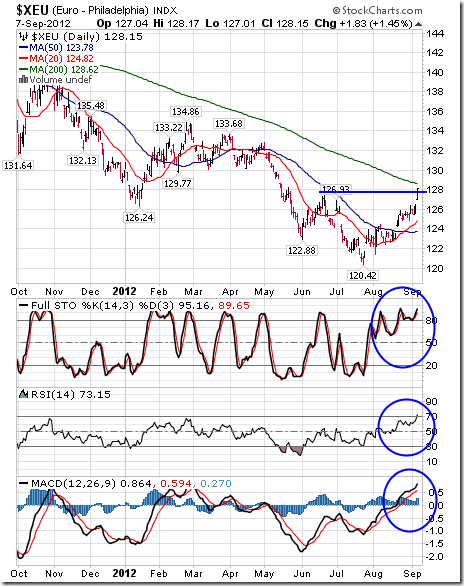
The Euro gained another 3.03 (2.42%) last week. Intermediate trend changed from down to neutral on a break above resistance at 126.93 on Friday. The Euro remains above its 20 and 50 day moving average and below its 200 day moving average. Short term momentum indicators are overbought, but have yet to show signs of peaking.
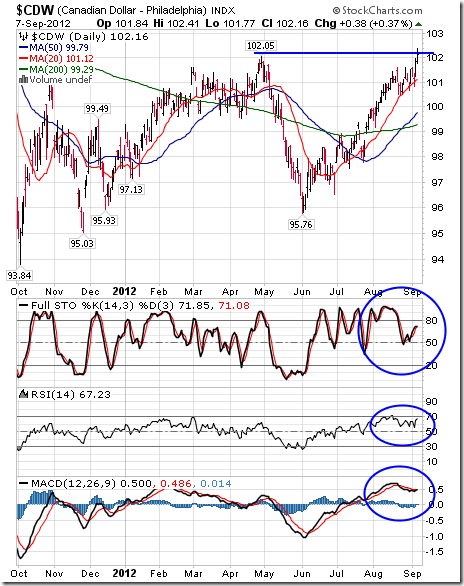
The Canadian Dollar gained another 1.38 cents U.S. (1.37%) last week. Intermediate trend changed from down to up on Friday when the Canuck buck broke above resistance at 102.05 cents to reach a 12 month high. Strength was notably stronger on Friday after an encouraging August employment report was released. The Dollar remains above its 20, 50 and 200 day moving averages. Short term momentum indicators have returned to an overbought level.
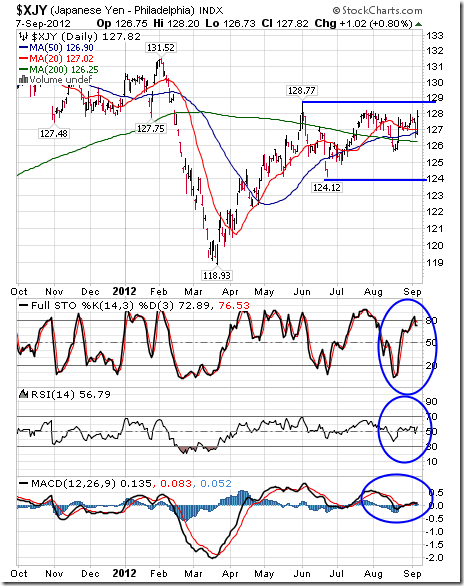
The Japanese Yen gained 0.70 (0.55%) last week. Intermediate trend is down. Short term trend is up. Resistance at 128.77 is being tested. The Yen remains above its 20, 50 and 200 day moving averages. Short term momentum indicators are trending higher.
Commodities
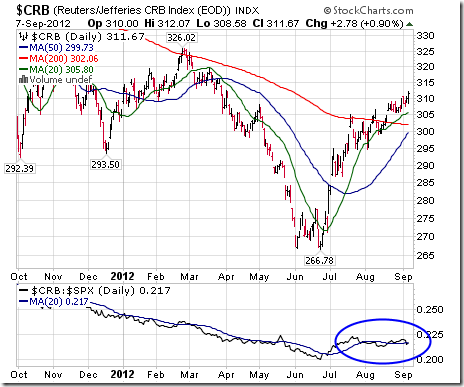
The CRB Index gained another 5.63 points (1.84%) last week. Most of the gains were recorded on Friday when the U.S. Dollar weakened. Intermediate trend is up. The Index remains above its 20, 50 and 200 day moving averages. Short term momentum indicators are trending higher. Strength relative to the S&P 500 Index remains neutral.
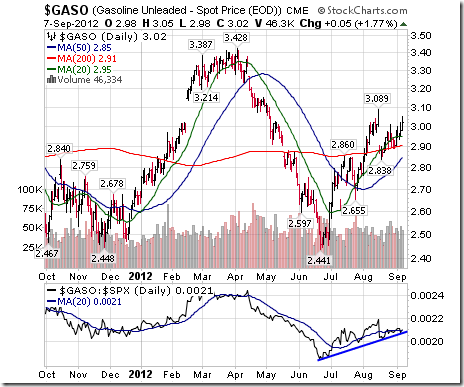
Gasoline added $0.10 (3.42%) last week. Gasoline remains above its 20, 50 and 200 day moving averages. Short term momentum indicators are trending higher. Strength relative to the S&P 500 Index remains positive.
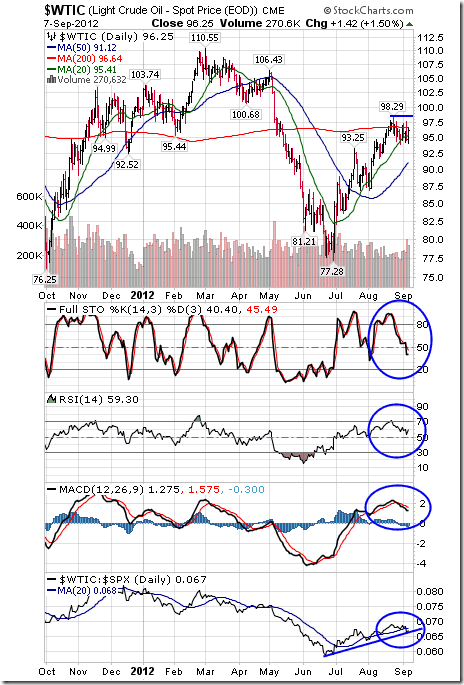
Crude Oil added $0.13 per barrel (0.14%) last week with more than all of the gain occurring on Friday. Crude remains above its 20 and 50 day moving averages and below its 200 day moving average. Short term momentum indicators have rolled over from overbought levels. Strength relative to the S&P 500 Index is positive, but showing early signs of change. Seasonal influences normally turn negative at the end of September
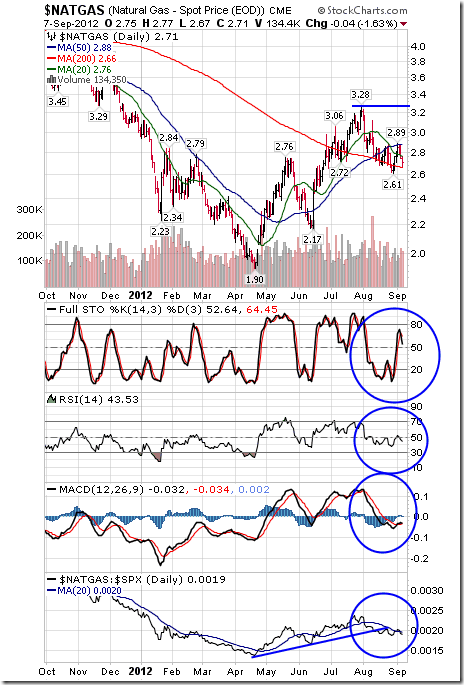
Natural Gas added $0.01 (0.37%) last week. Intermediate trend is up. Gas remains above its 200 day moving average and below its 20 and 50 day moving averages. Short term momentum indicators are neutral. Strength relative to the S&P 500 Index has turned negative from positive.
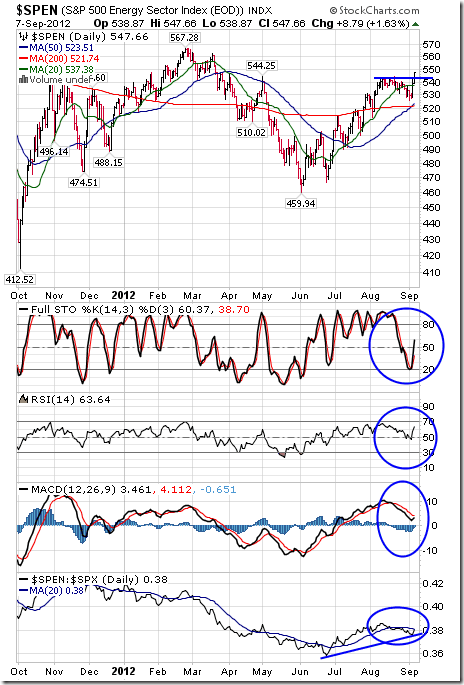
The S&P Energy Index added 10.02 points (1.86%) last week. Intermediate trend is up. Resistance at 544.46 was broken on Friday. The Index remains above its 50 and 200 day moving averages and moved above its 20 day moving average on Thursday. Short term momentum indicators are trending higher. Strength relative to the S&P 500 Index is positive, but showing signs of change. Favourable seasonal influences peak in mid-September.
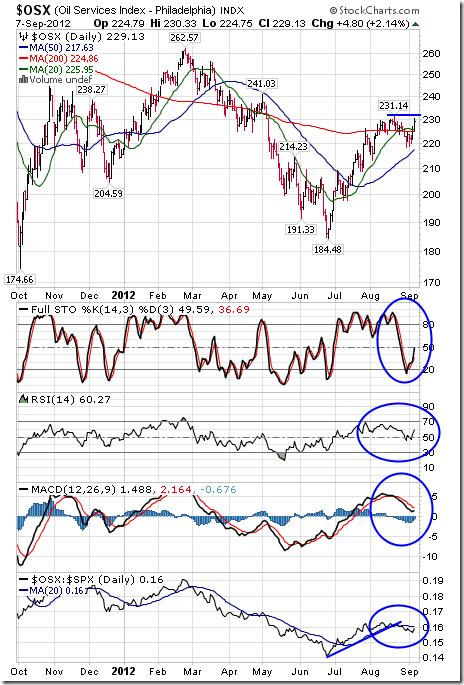
The Philadelphia Oil Services Index added 2.47 points (1.09%) last week. The Index remains above its 50 day moving average and moved above its 20 and 200 day moving averages on Friday. Short term momentum indicators are neutral. Strength relative to the S&P 500 Index has changed from up to at least neutral
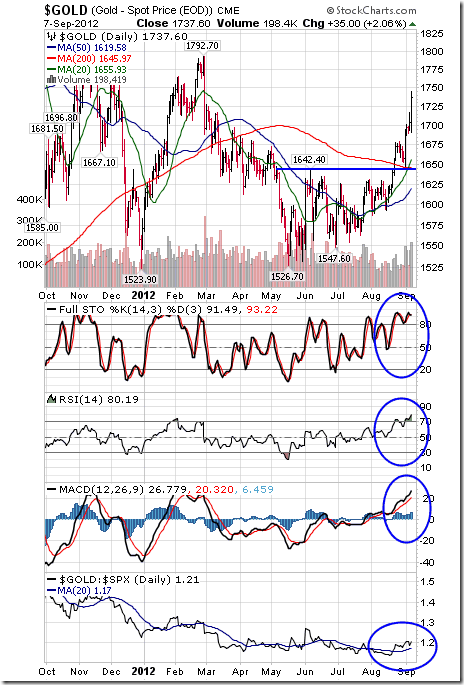
Gold gained $64.20 per ounce (3.84%) last week on weakness in the U.S. Dollar. Intermediate trend is up. Gold remains above its 20, 50 and 200 day moving averages. Short term momentum indicators are overbought, but have yet to show signs of peaking. Strength relative to the S&P 500 Index remains positive.
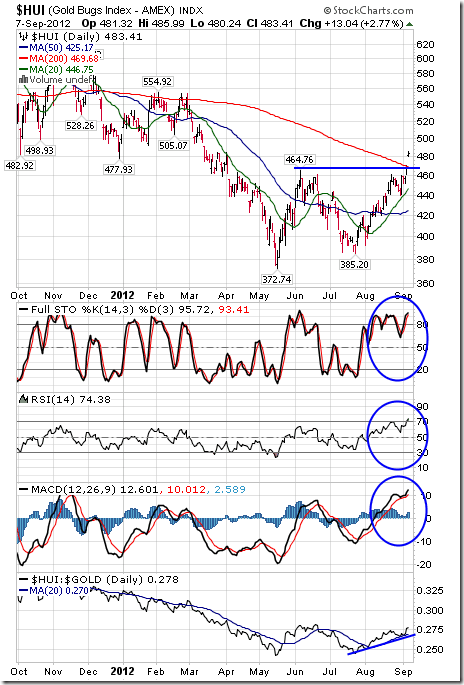
The AMEX Gold Bug Index added another 27.51 points (6.03%) last week. Intermediate trend changed from down to up when the Index broke resistance at 464.76. The Index remains above its 20 and 50 day moving averages and broke above its 200 day moving average on Friday. Short term momentum indicators are overbought, but have yet to show signs of peaking. Strength relative to gold remains positive.
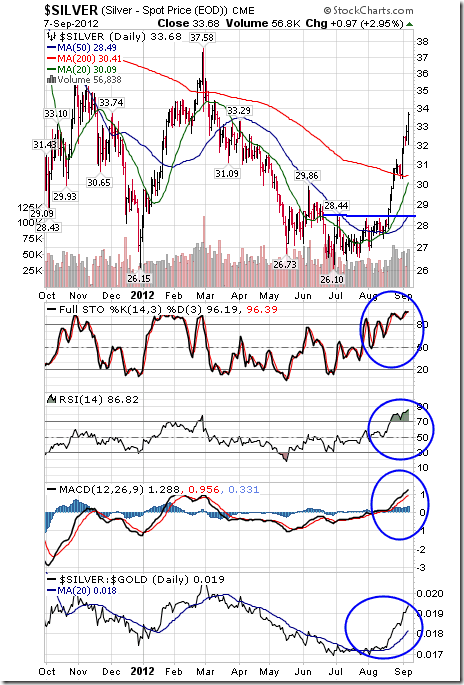
Silver gained another $3.10 per ounce (10.14%) last week. Intermediate trend is up. Silver remains above its 20, 50 and 200 day moving averages. Short term momentum indicators are overbought, but have yet to show signs of peaking. Strength relative to gold remains positive.
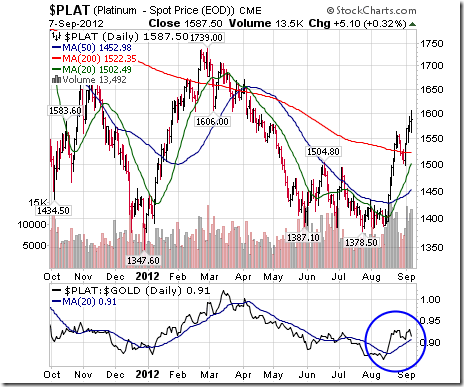
Platinum added $36.00 per ounce (2.32%) last week. Platinum remains above its 20, 50 and 200 day moving averages. Strength relative to gold is positive, but stalled.
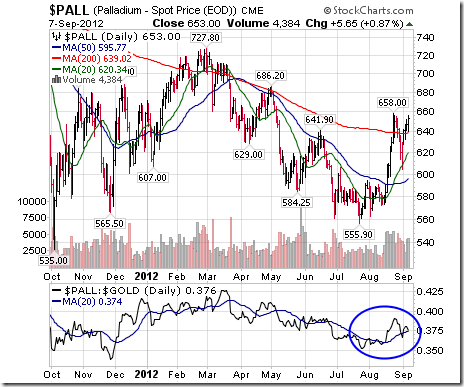
Palladium added $33.40 per ounce (5.39%) last week. Palladium remains above its 20 and 50 day moving averages and moved above its 200 day moving average. Strength relative to gold remains slightly positive.
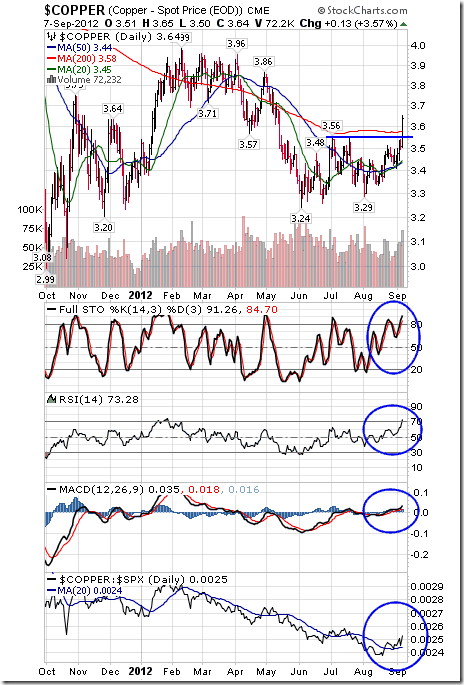
Copper gained $0.15 per lb. (4.30%) last week with almost all of the gain coming on Friday following news of China’s fiscal stimulation program. Intermediate trend changed from down to up on a break above resistance at $3.56 on Friday. Copper remains above its 20 and 50 day moving average and moved above its 200 day moving average on Friday. Short term momentum indicators are overbought, but have yet to show signs of peaking. Strength relative to the S&P 500 Index has turned from negative to positive.
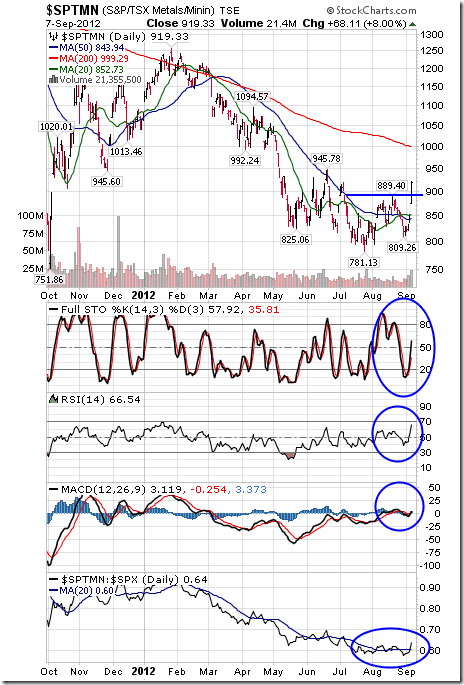
The TSX Global Metals & Mining Index gained 60.73 points (7.07%) last week with more than the entire gain recorded on Friday following the news from China. Intermediate trend changed from down to up on a break above resistance at 889.40. The Index remains below its 200 day moving average and recovered above its 20 and 50 day moving averages on Friday. Strength relative to the S&P 500 Index changed from negative to at least neutral on Friday.
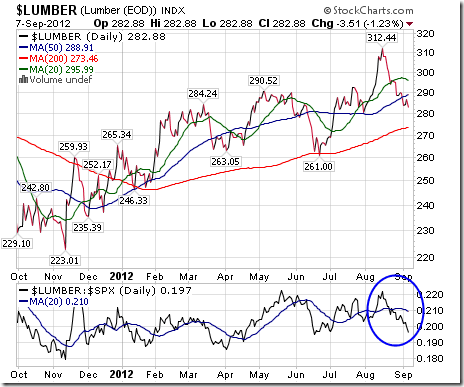
Lumber fell $12.32 (4.17%) last week. Intermediate trend is up. Lumber remains below its 20 day moving average and fell below its 50 day moving average last week. Strength relative to the S&P 500 Index has turned negative.
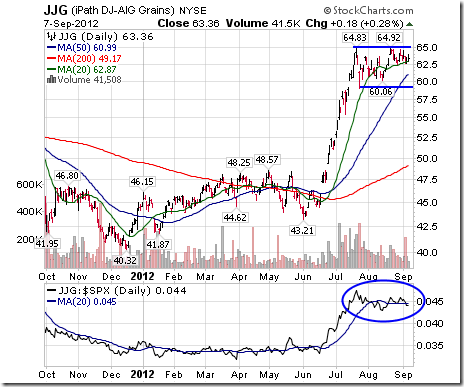
The Grain ETN slipped $0.09 (0.14%) last week. Units remain above their 20, 50 and 200 day moving averages. Strength relative to the S&P 500 Index remains neutral.
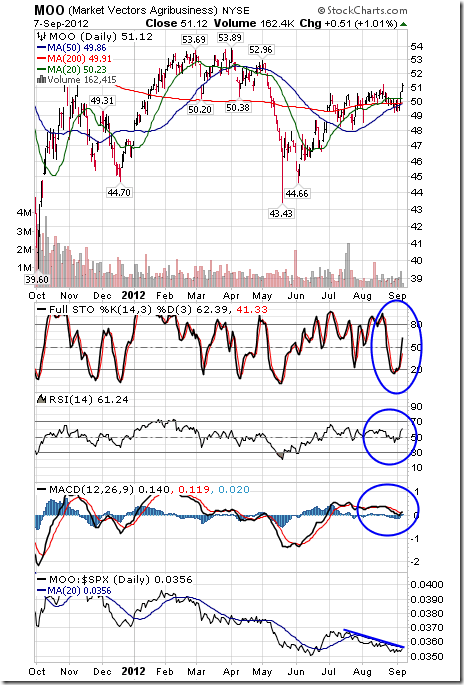
The Agriculture ETF added $0.95 (1.89%) last week. Intermediate trend is up. The ETF closed at a four month high on Friday. Units remain above their 20, 50 and 200 day moving average. Short term momentum indicators are trending higher. Strength relative to the S&P 500 Index remains negative.
Interest Rates
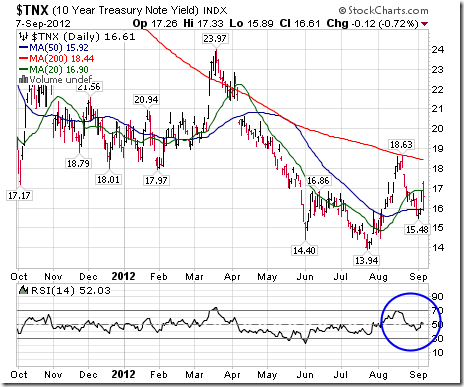
The yield on 10 year Treasuries added 9.9 basis points (6.34%) last week. Yield moved above its 50 day moving average. Short term momentum indicators are neutral.
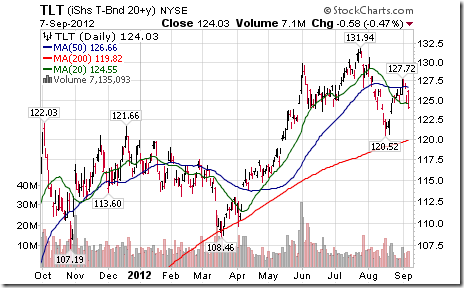
Conversely, price of the long term Treasury ETF fell $3.89 (2.89%) last week.
Other Issues
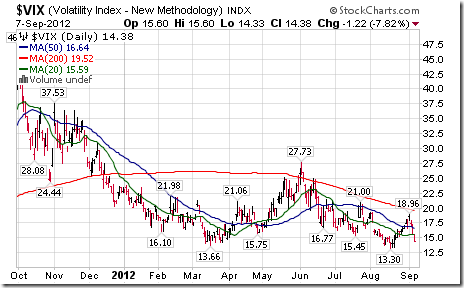
The VIX Index fell 0.80 (5.27%) last week. The Index fell below its 20 and 50 day moving averages on Friday.
Two unexpected events last week triggered a surprising upside move in equity markets last week, China’s $150 billion fiscal stimulus package announced on Thursday night and the ADP report showing a gain in U.S. private employment in August instead of a loss. Gains were muted on Friday when the less than expected U.S. employment report was released.
The economic focus this week is on the FOMC meeting. The Fed widely is expected to announce an additional monetary stimulus program that probably will include the purchase of mortgage backed securities by the Fed that effectively will replace Operation Twist that is expected to expire at the end of the month. However, the effectiveness of a new program is somewhat suspect. At best, it may reduce mortgage rates slightly, but mortgage rates already are near all-time lows. Importance of an additional monetary stimulus program is psychological (Investors relate monetary stimulus to higher equity prices). If the Fed chooses not to introduce another stimulus program, equity markets are vulnerable to significant short term downside risk. If the Fed chooses to go beyond a token purchase (or promise to purchase) mortgage backed securities, equity markets will move higher. The Fed in order to show political neutrality is unlikely to act beyond the September FOMC meeting until after the election.
U.S. economic news other than the FOMC meeting is expected to be neutral to slightly bearish for equity markets this week (higher trade deficit, higher inflation, higher inventories, lower consumer sentiment, but continuing strength in retail sales).
Macro events outside of the U.S. once again focuses on China this weekend and Europe later this week. Negotiations between ECB President Draghi and Greece continue on Tuesday. The German constitutional court rules on the eligibility of ECB lending on Wednesday. The Netherlands holds parliamentary elections on Wednesday.
Short and intermediate technical indicators for most equity markets and sectors improved last week but have returned to overbought levels.
North American equity markets have a history of moving lower from September to mid-October during a U.S. Presidential election year (particularly when polls show a tight race as indicated this year). Thereafter, equity markets move higher.
Cash on the sidelines on both sides of the border is substantial and growing. However, political uncertainties (including the Fiscal Cliff) preclude major commitments by investors and corporations before the Presidential election.
The Bottom Line
Downside risk exceeds upside potential in equity markets during the next six weeks. The breakout by the S&P 500 Index last week implies that depth of the downside risk is less than previous. Selected seasonal trades continue on the upside (gold, energy, software) and downside (transportation). However, many of these seasonal trades reach the end of their period of seasonal strength this month. September is a month of transition. Trade accordingly.
Keith Richards’ Blog
Gold bullion has been a great place to be lately, and I’ve had a position in the portfolios I run for about a month now. But gold stocks are lagging. So too is the materials sector. They may be ready for a breakout. Find out more on my blog at http://www.smartbounce.ca/?p=1407
Special Free Services available through www.equityclock.com
Equityclock.com is offering free access to a data base showing seasonal studies on individual stocks and sectors. The data base holds seasonality studies on over 1000 big and moderate cap securities and indices.
To login, simply go to http://www.equityclock.com/charts/
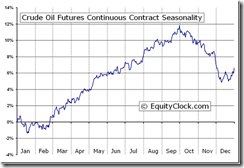
Following is an example:
Crude Oil Futures (CL) Seasonal Chart
ETF News
The latest weekly update on ETFs in Canada to September 7th is available at
Disclaimer: Comments and opinions offered in this report at www.timingthemarket.ca are for information only. They should not be considered as advice to purchase or to sell mentioned securities. Data offered in this report is believed to be accurate, but is not guaranteed.
Don and Jon Vialoux are research analysts for Horizons Investment Management Inc. All of the views expressed herein are the personal views of the authors and are not necessarily the views of Horizons Investment Management Inc., although any of the recommendations found herein may be reflected in positions or transactions in the various client portfolios managed by Horizons Investment Management Inc
Horizons Seasonal Rotation ETF HAC September 7th 2012


