Interesting Charts
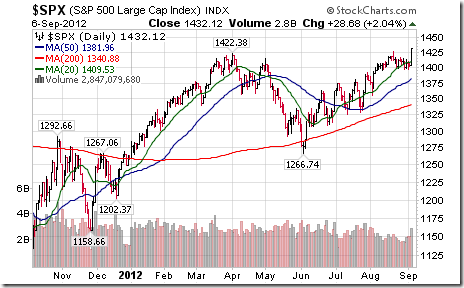
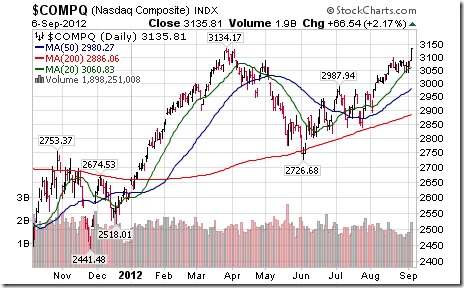
Surprising strength yesterday in equity markets! Most of the upside technical action occurred following released of the August ADP report that substantially exceeded consensus. (Equity markets briefly sold off after Draghi’s news conference, but quickly regained momentum thereafter). Traders quickly began raising estimates for August Non-farm Payrolls to be released today at 8:30 AM EDT. A word of caution! The Non-farm Payroll report is infamous for its variability to consensus and for its revisions. Major U.S. equity indices broke August 21st highs to reach multi-year highs.
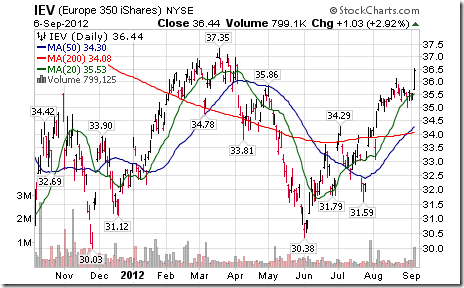
European equity markets led the advance with 3% gains.
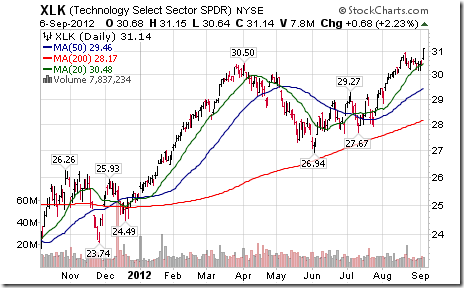
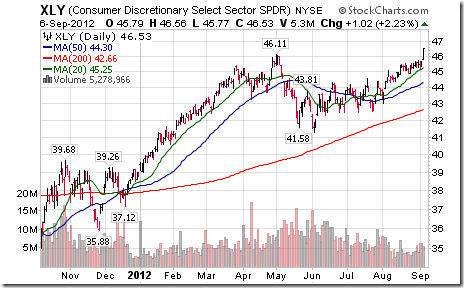
Economically sensitive sectors led gains in the U.S. Consumer Discretionary and Technology SPDRs broke to new highs.
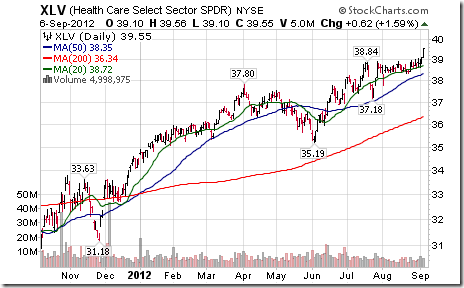
Health Care SPDRs closed at an all-time high.
Updates on Seasonal Trades Recommended Since July
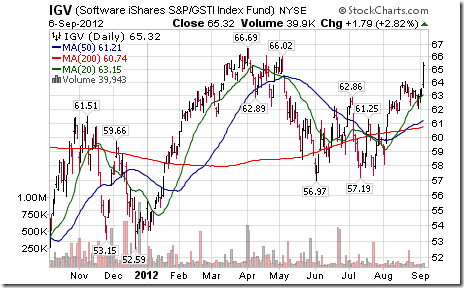
July 2 Accumulate the Software sector
ETF: IGV at $62.18. Current price: $65.32
Comment: Technicals remain positive. Intermediate trend is up. Nice breakout yesterday above short term resistance at $64.12. Units remain above their 20, 50 and 200 day moving averages. Strength relative to the S&P 500 Index remains positive. Continue to hold.
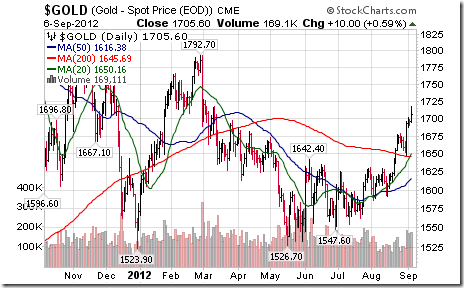
July 6: Accumulate gold bullion
Gold price: $1,578.90. Current price: $1,705.60
Comment: Technicals remain positive. Gold remains above its 20, 50 and 200 day moving averages (Completed a “golden cross” yesterday). Strength relative to the S&P 500 Index remains positive. Continue to hold.
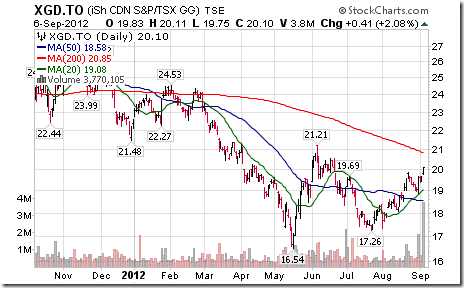
July 13: Accumulate Canadian gold equities
ETF: XGD at $18.01. Current price: $20.10.
Comment: Technicals remain positive. Nice pop in volume today. Units remain above their 20 and 50 day moving averages. Strength relative to the TSX Composite Index and S&P 500 Index remains positive. Continue to hold.
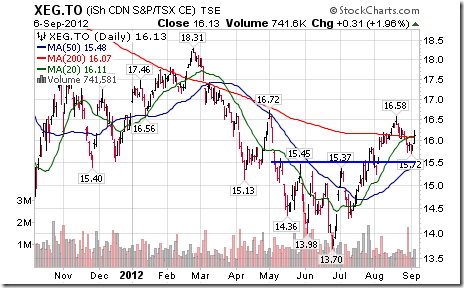
July 20: Accumulate the Canadian Energy sector
ETF: XEG: at $15.12. Current price: $16.13.
Comment: Technicals remain positive. Intermediate trend is up. Nice bounce from near the top of its reverse head and shoulder pattern. Units remains above their 50 day moving average and closed above their 20 and 200 day moving average yesterday. Strength relative to the TSX Composite Index is slightly negative. Continue to hold
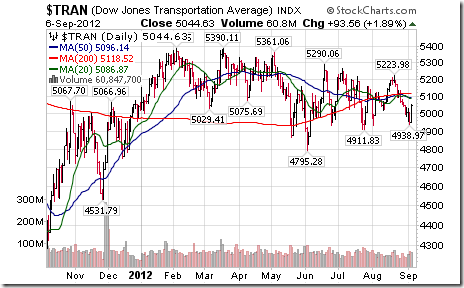
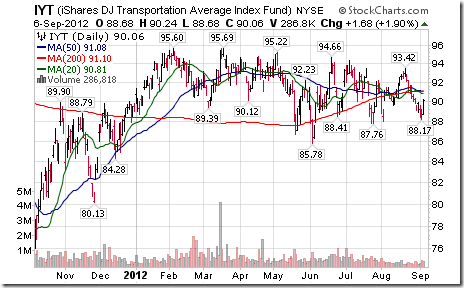
July 27: Sell the Transportation Sector
Dow Jones Transportation Average at 5,126.65. Current price: 5,044.63
ETF: IYT at $91.56. Current price: $90.06.
Comment: Technicals remain negative. Units remain below their 20, 50 and 200 day moving averages. Strength relative to the S&P 500 Index remains negative despite yesterday’s strength. Continue to sell/avoid/short.
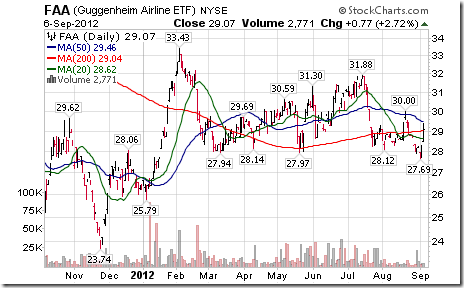
August 6: Sell the Airline sector
ETF: FAA at $28.66. Current price: $29.07
Comment: Technicals improved last week, but not sufficient to change a negative opinion. Units reached an 8 month low on Wednesday before recovering sharply yesterday. Units moved above their 20 and 200 day moving averages yesterday. However, intermediate trend remains down and strength relative to the S&P 500 Index remains negative. Continue to sell/avoid/short.
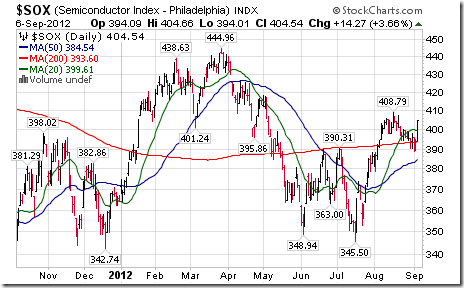
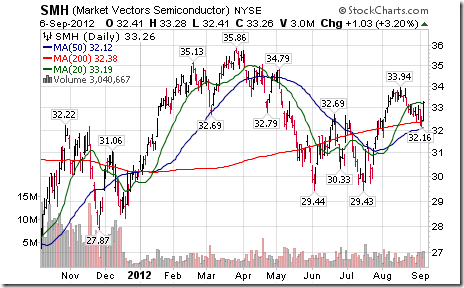
August 28: Sell the Semiconductor sector
Philadelphia Semiconductor Index: 397.04. Current price: 404.54
ETF: SMH at $32.83. Current price: $33.26
Comment: Technicals have improved since August 28th following the sharp gain yesterday. The Index and its ETFs recovered above their 20 and 200 day moving averages. Intermediate trend is neutral. Strength relative to the S&P 500 Index remains negative. Continue to sell/avoid/short, but place stops just above recent highs (408.79 for the Index and $33.94 for the ETF).
Eric Wheatley’s Listed Options Column
Hi guys,
I got an email from Mr. Rol, well-known and respected denizen of our comments section. He was asking whether I could build a model portfolio here and update it, to show exactly what I do with options. My response was that I’d love to, but unfortunately it is risky from a compliance standpoint. Given that John (Mr. Hood to me) and I are portfolio managers who can act with discretion in managing our clients’ assets, we are held to a higher standard of fiduciary care. If a client sees our model portfolio outgaining his or her own (which is managed according to his or her own risk/return profile), we may get a complaint and an unhappy client. Complaints, even unfounded ones, can ruin a finance professional’s reputation. John likes having a good reputation (and I’d like to hold onto whatever weird reputation I may have). Hence, we can’t put up a model portfolio.
What I can do is to give a little insight into our use of covered calls. Depending on the client and his or her understanding of options, I’ll usually set a core allocation to broad indices which are covered with written calls. The other portion of the equity allocation will be set with low-cost ETFs which cover sectors or geographical regions we either like or need to be exposed to. We don’t cover these with calls, not because we don’t want to, but we are Canadian, we have Canadian clients who will be (or are) living off of Canadian dollars in retirement. Other than on the absolutely deepest and most highly-traded stocks, the Canadian options market is just too illiquid to do large options trades.
(Of course, there a couple clients who will be living a portion of their retired lives elsewhere; in which case we can diversify their assets by buying American stocks and cover them in an infinitely deeper options market).
The reason we HAVE to be exposed to other regions goes beyond diversification. China’s stock market has been getting killed for a while, but disregarding the world’s second largest economy which could rebound violently at any time is not productive. A small allocation to emerging markets provides us with exposure outside North America, which is important. The downside to this is that emerging market ETFs are, understandably, significantly more expensive in terms of management fees, so we keep the allocations reasonable in order to lower the overall management costs of a given portfolio.
Now, if I buy the broad market Canadian index which has liquid options (and which, by the way, I used to be a market-maker on), here is an example of the available options from which I can choose:
The XIUs are at $17.43 and we’re two weeks away from the September expiry. Here are a few of the calls:
Here, I guess I have to explain my back-of-a-napkin methodology:
· Time value for an out-of-the-money call (i.e. which has a strike price ABOVE the current price of the stock; which makes the option unprofitable to be struck by its holder at this time) is equal to its bid price. The time value of an in-the-money call is its bid price minus its intrinsic value (i.e. the amount the call’s holder would make right now if he or she were to strike it).
· Fees for our clients (an institutional brokerage’s transaction fees) are a straight three cents per share with a fixed floor of 1,000 shares. This gets deducted directly from an option’s bid price. Your direct broker may charge less. Your full-service broker most certainly charges one heck of a lot more. I’ll assume readers here don’t deal with a full-service broker, especially for options trades.
· Returns are a percentage of the call’s premium versus the purchase price of the stock (for out-of-the-money calls) or the time value divided by the option’s strike price (for in-the-money calls).
· I counted the number of weeks until the option’s expiry to determine the annual return (e.g. for the December 17.50 calls, I multiplied 2.81% by 52 weeks and divided by the 15 weeks remaining until the December expiry).
There are, of course, many other considerations, notably what I think the Canadian market will be doing over the course of the call’s lifetime and how implied volatilities are doing (whether they’re historically high or low and where I think they’re headed). In any case, you’ll notice that even on one of Canada’s most liquid and highly-traded options classes, there are still four to eight cents between the bid and the ask. This is actually pretty good, but they usually aren’t good for much more than 10-20 contracts. When you’re managing money for many clients, there’s a good reason you pay extra for institutional traders: they’ll find buyers for size without moving the price too much.
In the above table, you have to weigh the better risk mitigation conferred by in-the-money calls against the better potential returns conferred by out-of-the-money calls. This goes with your anticipation of how the markets will be doing over the coming months. In this particular case – indeed, in most cases – there is no absolute “right” call to sell. I always prefer selling nearer-term options if the transaction costs aren’t too onerous for two good reasons: a) the client’ll make more money over time and b) it’s easier to have a solid opinion on the markets over a shorter timeframe. Here, I’d be looking at the November 17.50s, because they seem to offer some reasonable juice in a market where options are historically cheap. The current stock price is a little too far away from the in-the-money strike price, so there isn’t enough downside protection in the form of time value to offset the lower returns. Of course, choosing the Novembers doesn’t mean that the Octobers or the Decembers are wrong; arguments in their favour can be made.
In selling the November 17.50s, I’m giving my client a 2.07% return for ten weeks. This 2.07% also protects a bit against a slide in the stock price. While it may not sound like a lot, using covered calls properly eventually brings in some reasonable returns (as I always mention, the 2.07% is the options market’s best estimation of the stock’s potential returns) for comparably low risk. Of course, this is in addition to the dividends which are paid out to ETF holders and minus the management fees, which for the XIUs is 0.17% per year.
I’ll come back at the November expiry to see how the call worked out (for you, Rol). Please note that this is a passive, low-cost, long-term strategy, so it can’t be really evaluated over the course of months no matter how successful (or not) it may turn out to be.
*****************
This Labour day week has brought about some great fortune for my family (no details shall be provided), but it does mean that the Twitter feed and the French-language blog have been silenced (I decided to pound this commentary out on Thursday morning, ‘cause I love you guys SOOOO much. Also, it takes significantly less effort than coming up with my weird stories and literary turns of phrase in Molière’s little language). Both will be back next week. For now, as you read this, I’ll be waking up with my rare but perfectly predictable Champagne headache.
…and no, dear ROCers, it hasn’t anything to do with an election.
Cheers!
Éric Wheatley, MBA, CIM
Associate Portfolio Manager, J.C. Hood Investment Counsel Inc.
eric@jchood.com
514.604.2829; 1.855.348.2829
Twitter: @jchood_eric_en
Blogue en français : gbsfinancier.blogspot.ca
*****************
Little known fact about John Charles Hood #42
John Charles Hood can open a bottle of Champagne in a manner unique to him which involves a dagger, a damp cloth and a particularly ruddy squirrel.
Special Free Services available through www.equityclock.com
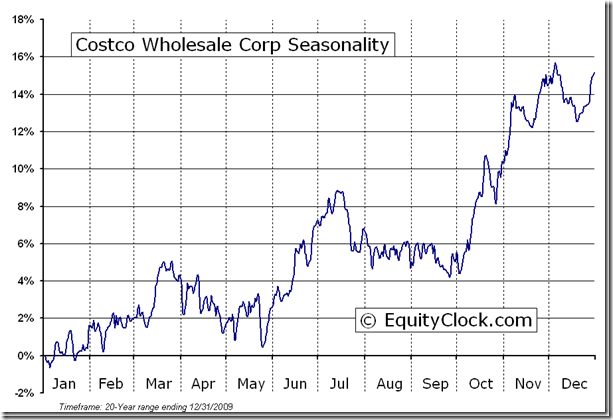
Equityclock.com is offering free access to a data base showing seasonal studies on individual stocks and sectors. The data base holds seasonality studies on over 1000 big and moderate cap securities and indices.
To login, simply go to http://www.equityclock.com/charts/
Costco Wholesale Corporation (NASDAQ:COST) Seasonal Chart
FP Trading Desk Headlines
FP Trading Desk headline reads, “Three reasons the ECB’s bond buying plan isn’t the bazooka it seems”. Following is a link to the report:
FP Trading Desk headline reads, “Close U.S. election bodes well for stocks”. Following is a link to the report:
http://business.financialpost.com/2012/09/06/close-u-s-election-bodes-well-for-stocks/
Disclaimer: Comments and opinions offered in this report at www.timingthemarket.ca are for information only. They should not be considered as advice to purchase or to sell mentioned securities. Data offered in this report is believed to be accurate, but is not guaranteed.
Don and Jon Vialoux are research analysts for Horizons Investment Management Inc. All of the views expressed herein are the personal views of the authors and are not necessarily the views of Horizons Investment Management Inc., although any of the recommendations found herein may be reflected in positions or transactions in the various client portfolios managed by Horizons Investment Management Inc
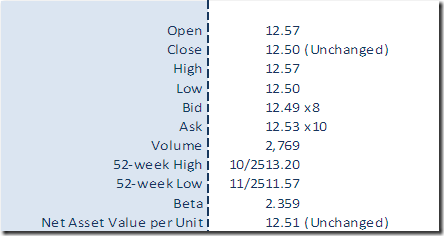
Horizons Seasonal Rotation ETF HAC September 6th 2012


