by Don Vialoux, EquityClock.com
Upcoming US Events for Today:
- Second Quarter Productivity will be released at 8:30am. The market expects a quarter-over-quarter increase of 1.9% versus an increase of 1.6% previous.
Upcoming International Events for Today:
- German Services PMI for August will be released at 3:55am EST. The market expects 48.3 versus 50.3 previous.
- Euro-Zone Services PMI for August will be released at 4:00am EST. The market expects 47.5 versus 47.9 previous.
- Euro-Zone Retail Sales for July will be released at 5:00am EST. The market expects a year-over-year decline of 1.8% versus a decline of 1.2% previous.
- The Bank of Canada Rate Decision will be released at 9:00am EST. The market expects no change at 1.00%.
Recap of Yesterday’s Economic Events:
| Event | Actual | Forecast | Previous |
| AUD Current Account Balance (Australian Dollar) | -11801M | -12200M | -12997M |
| AUD Reserve Bank of Australia Rate Decision | 3.50% | 3.50% | 3.50% |
| CHF Gross Domestic Product (QoQ) | -0.10% | 0.20% | 0.50% |
| CHF Gross Domestic Product (YoY) | 0.50% | 1.60% | 1.20% |
| GBP Purchasing Manager Index Construction | 49 | 50 | 50.9 |
| EUR Euro-Zone Producer Price Index (MoM) | 0.40% | 0.20% | -0.50% |
| EUR Euro-Zone Producer Price Index (YoY) | 1.80% | 1.60% | 1.80% |
| USD Markit US PMI Final | 51.5 | 51.9 | 51.4 |
| USD ISM Manufacturing | 49.6 | 50 | 49.8 |
| USD ISM Prices Paid | 54 | 46 | 39.5 |
| USD Construction Spending (MoM) | -0.90% | 0.40% | 0.40% |
| GBP Purchasing Manager Index Services | 53.7 | 51.1 | 51 |
| USD Total Vehicle Sales | 14.5M | 14.17M | 14.05M |
| USD Domestic Vehicle Sales | 11.6M | 11.00M | 11.00M |
| AUD AiG Performance of Service Index | 42.4 | 46.5 |
The Markets
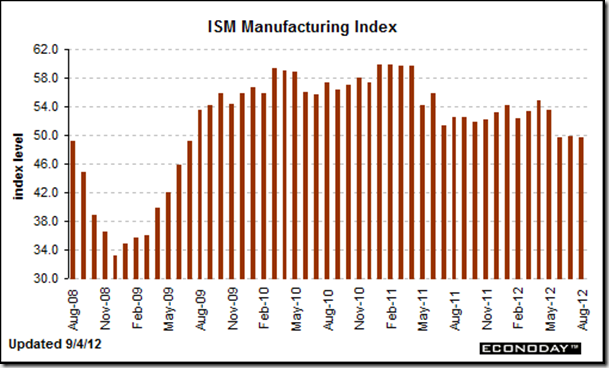
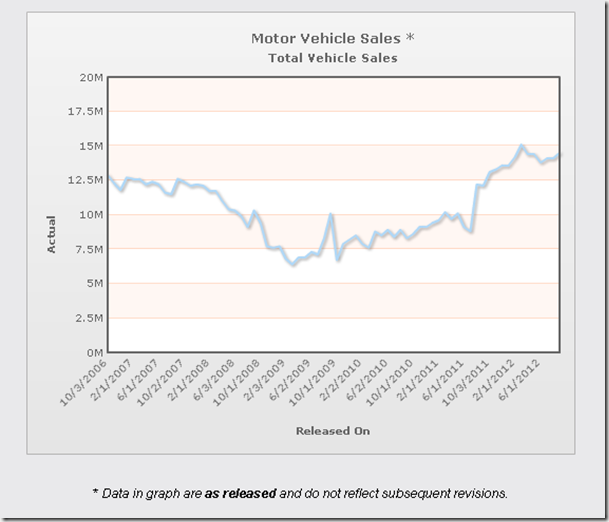
Markets ended flat on Tuesday following diverging data points that profiled an economy moving in two different directions. The ISM Manufacturing Index issued another contractionary number at 49.6, due to slowing production as a result of a lack of new orders. The Index has been declining since the highs set back in 2010, reiterating the prolonged weakness in this area of the economy. An unexpected decline in Construction Spending for the month of July topped off the negative dataset on the day. Offsetting the negative was an surprising increase in automobile sales for the month of August, climbing 2.8% over the month previous. Bespoke Investment points out that “sales of Ford F-Series trucks rose by 19.3% to 58,201” putting the company on pace to record the highest annual total since 2007. Bespoke notes that sales of small trucks, such as Ford’s F-series, is a “good glimpse into the health of the overall economy” as small business owners account for a significant portion of the sales of these automobiles. So one set of data points to a contracting economy, while another points to an expanding one. No wonder equities traded on either side of the flat-line.
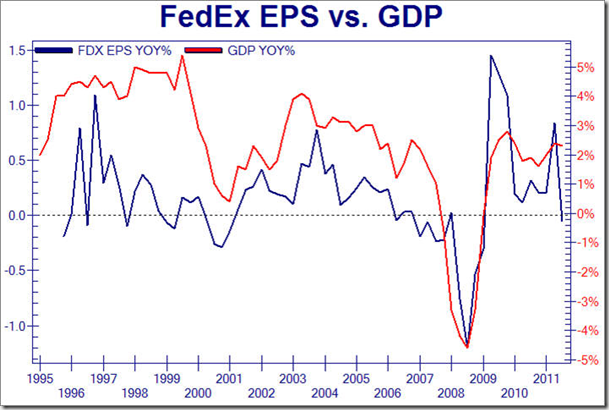
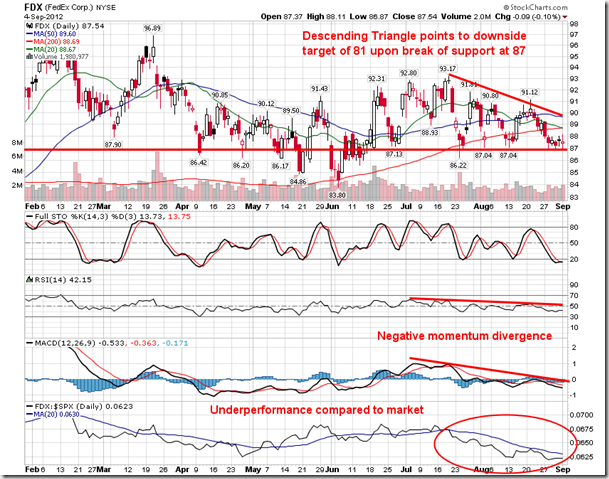
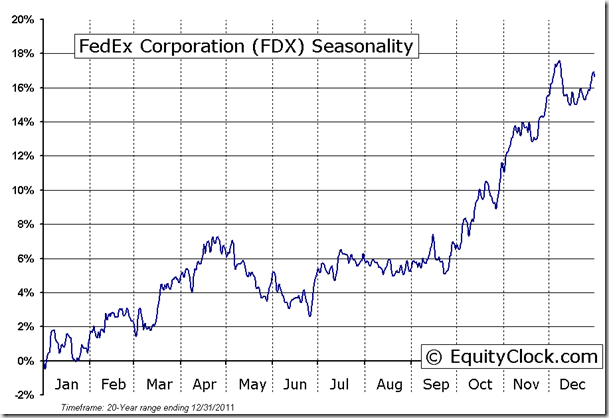
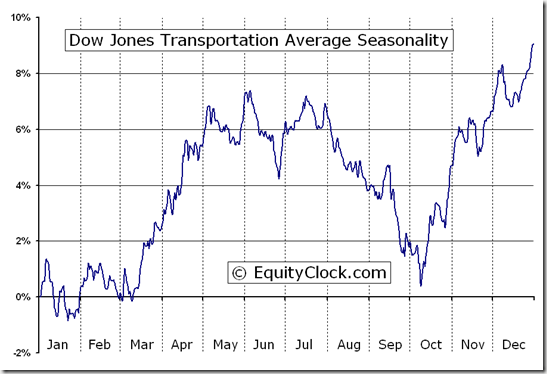
Perhaps providing more of a leading indication of the direction of the economy was FedEx’s earnings warning on Tuesday after the closing bell. According to CNBC “the shipping giant now expects earnings for the quarter ended Aug. 31 to range between $1.37 to $1.43 a share, compared to $1.46 a share last year.” FedEx earnings have a strong correlation to GDP, suggesting that expectations for the economy have to be lowered. The transportation industry is particularly weak on a seasonal basis during the month of September, acting as a leading indicator to broad market weakness during the same period. This news from this economic bellwether is only expected to exacerbate current weakness in the industry. The Dow Jones Transportation Index has been underperforming the market for the majority of summer as climbing oil prices and slowing industrial activity place negative pressures on stocks in this space. The underperformance in transportation stocks is obvious on the chart of FedEx, which also finds itself within a descending triangle pattern. This bearish setup points to downside targets of $81 upon a break of support at $87. Weakness in transports could be foretelling negative things to come for the broad market.
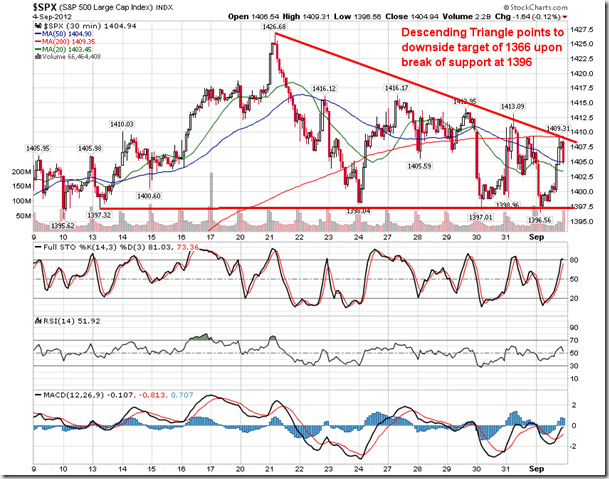
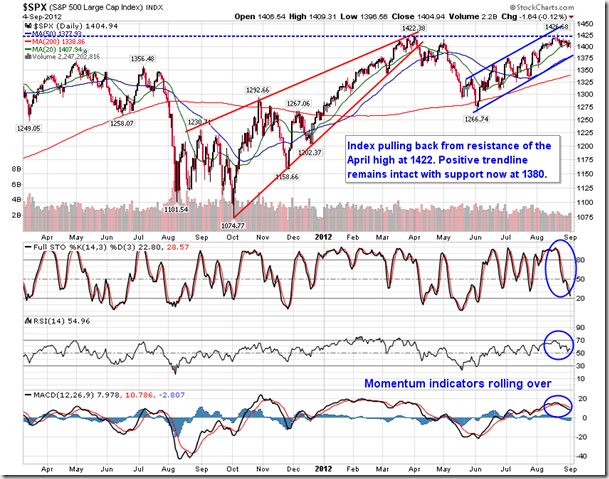
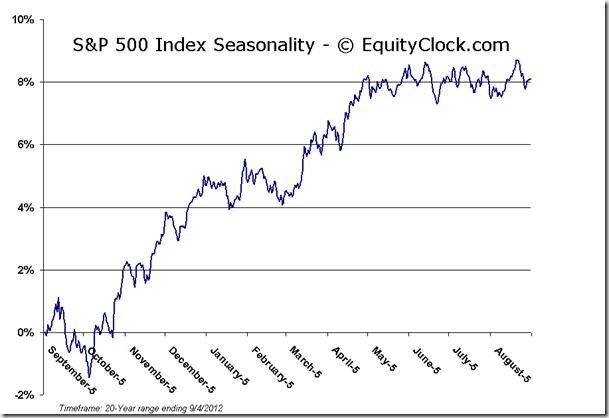
Another descending triangle is presently obvious on the 30-minute chart of S&P 500 Index. The pattern dates back to the significant reversal day realized on August 21st when markets opened sharply higher only to close negative, exceeding the previous day’s range. Support for the bearish setup sits at 1396 with a break below suggesting downside potential all the way to 1366, a mere 2.8% below present levels. The negative technical setup coincides with negative seasonal tendencies during the month of September and uncertain fundamentals that are failing to provide further upside momentum through areas of resistance. Investors are increasingly becoming risk averse, as was clearly evident on Tuesday with defensive sectors (health care, utilities, and consumer staples) the only market segments to produce gains on the session, typically a precursor to broad market declines.
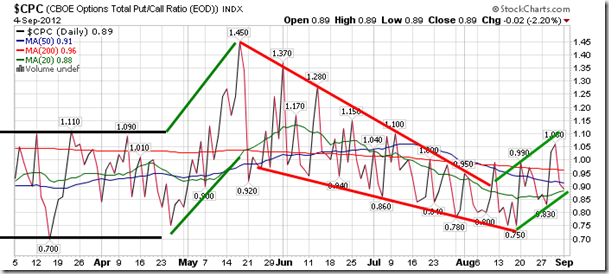
Sentiment on Tuesday, as gauged by the put-call ratio, ended bullish at 0.89.
Chart Courtesy of StockCharts.com
Chart Courtesy of StockCharts.com
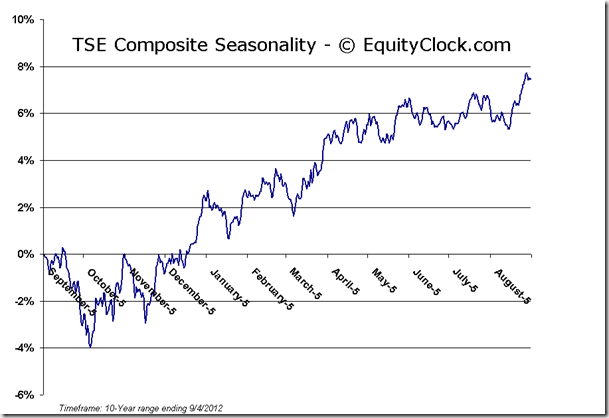
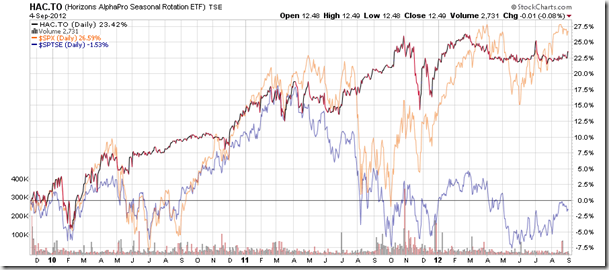
Horizons Seasonal Rotation ETF (TSX:HAC)
- Closing Market Value: $12.49 (down 0.08%)
- Closing NAV/Unit: $12.51(up 0.13%)
Performance*
| 2012 Year-to-Date | Since Inception (Nov 19, 2009) | |
| HAC.TO | 2.71% | 25.1% |
* performance calculated on Closing NAV/Unit as provided by custodian
Click Here to learn more about the proprietary, seasonal rotation investment strategy developed by research analysts Don Vialoux, Brooke Thackray, and Jon Vialoux.
Copyright © EquityClock.com


