by Frank Holmes, U.S. Global Investors
That’s the question Harvard Business School’s Diego Comin wanted to answer. His research analyzed how quickly 15 different technologies—including steamships, the telegraph, the Internet, MRI scanners, electricity—have been adopted by 166 different countries over the past two centuries to determine if there is a relationship between a country’s historical rate of adoption and its per capita income.
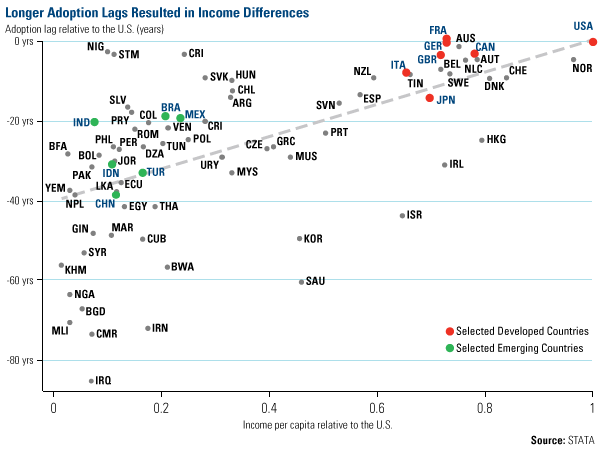
He found that a strong association between the two exists. Not only did his research show that the United States and the United Kingdom had the fastest adoption rates, countries’ delays “account for at least 25 percent of cross-country per capita income differences.”
The chart below shows this relationship between tech adoption and per capita income, with each country’s data plotted relative to that of the U.S. The left axis plots how much longer a country took to incorporate a new technology compared to the U.S. in the number of years; the bottom axis charts the income per capita relative to the U.S. You can see that the bigger the lag in comparison to the U.S., the lower the income per capita tended to be, and vice versa.

Read Harvard Business School’s article, “How Technology Adoption Affects Global Economies,” now.
By clicking the link above, you will be directed to a third-party website. U.S. Global Investors does not endorse all information supplied by this website and is not responsible for its content.
Copyright © U.S. Global Investors


