(Editor’s Note: Mr. Vialoux is scheduled to appear on BNN today at 11:30 AM EDT)
Economic News This Week
The June Case/Shiller 20 City Home Price Index to be released on Tuesday at 9:00 AM EDT is expected to improve on a year-over-year basis from -0.7% to -0.3%.
The August Consumer Confidence Index to be released at 10:00 AM EDT on Tuesday is expected to slip to 65.5 from 65.9.
The Fed Beige Book is scheduled to be released at 2:00 PM EDT on Wednesday.
U.S. second quarter revised real annualized GDP to be released at 8:30 AM EDT on Wednesday is expected to be revised upward to 1.7% from 1.5%.
July Personal Income to be released at 8:30 AM EDT on Thursday is expected to increase 0.3% versus a 0.5% gain in June. July Personal Spending is expected to increase 0.5% versus no change in June.
Weekly Initial Jobless Claims to be released at 8:30 AM EDT on Thursday are expected to slip to 370,000 from 372,000 last week.
Canada’s June GDP to be released at 8:30 AM EDT on Friday is expected to slip to 1.6% on a year-over-year basis versus growth at 1.9% rate.
The August Chicago Purchasing Manager’s Index to be released at 9.45 AM EDT on Friday is expected to slip to 53.5 from 53.7 in July.
The August Michigan Consumer Sentiment Index to be released at 9:55 AM EDT on Friday is expected to remain unchanged at 73.6.
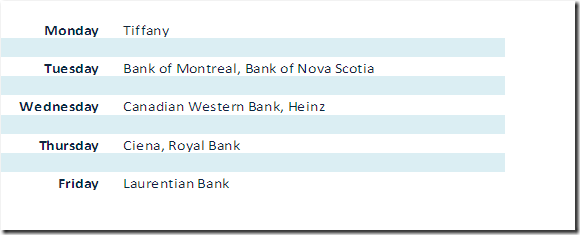
Earnings Reports This Week
Equity Trends
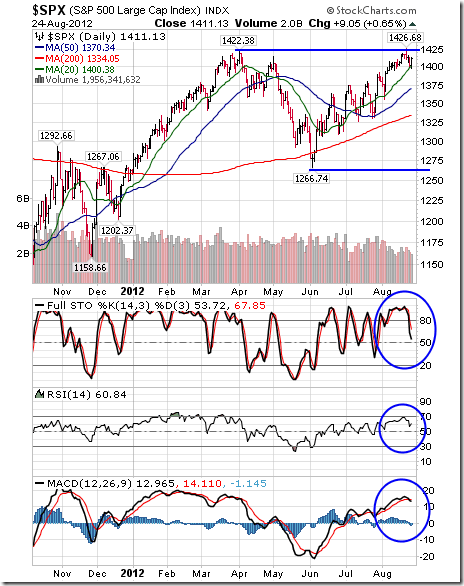
The S&P 500 Index slipped 7.03 points (0.50%) last week. Intermediate trend changed from neutral to up when the Index briefly moved above resistance at 1,422.38. However, the Index also recorded a bearish key reversal last Tuesday implying the likelihood of at least a short term peak. The Index remains above its 50 and 200 day moving averages, but is testing its 20 day moving average. Short term momentum indicators have rolled over from overbought levels and are trending down.
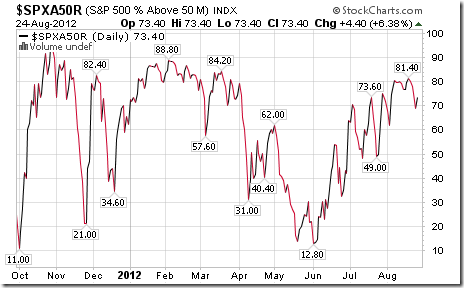
Percent of S&P 500 stocks trading above their 50 day moving average fell last week to 73.40% from 81.40%. Percent is intermediate overbought and has rolled over from above the 80% level, a frequent indicator that the Index has passed a short term peak.
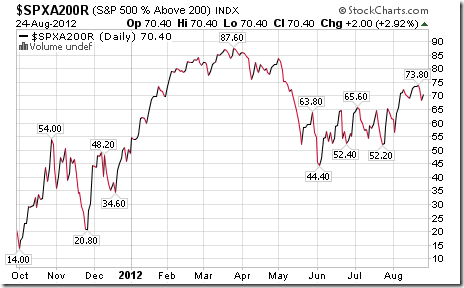
Percent of S&P 500 stocks trading above their 200 day moving average slipped last week to 70.40% from73.40%. Percent is intermediate overbought and showing early sign of peaking
The ratio of S&P 500 stocks in an uptrend to a downtrend (i.e. the Up/Down ratio) slipped last week to (279/127=) 2.20 from 2.26. Twenty three stocks broke resistance and 24 stocks broke support (mostly utility stocks).
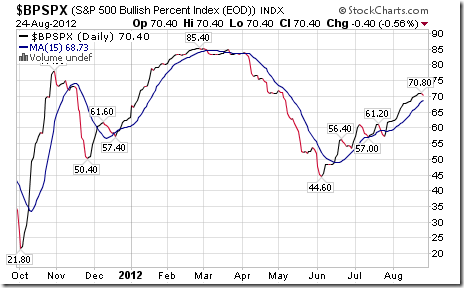
Bullish Percent Index for S&P 500 stocks increased last week to 70.40% from 70.00% and remained above its 15 day moving average. The Index is intermediate overbought.
The Up/Down ratio for TSX Composite stocks increased last week to (151/73=) 2.07 from 1.72. Twenty stocks broke resistance and two stocks broke support.
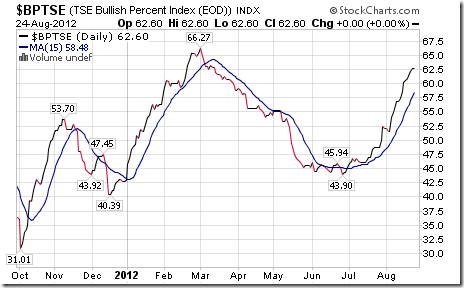
Bullish Percent Index for TSX Composite stocks increased last week to 62.60% from 60.57% and remained above its 15 day moving average. The Index remains intermediate overbought.
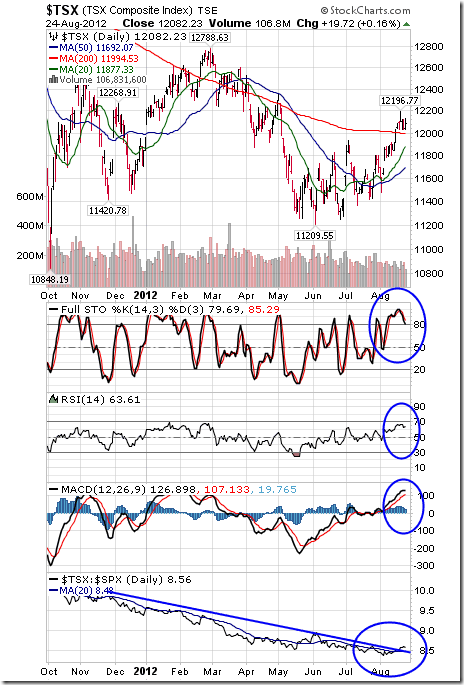
The TSX Composite Index slipped 7.66 points (0.06%) last week. Intermediate trend is up. The Index remains above its 20, 50 and 200 day moving averages. Short term momentum indicators are overbought and showing early signs of rolling over. Strength relative to the S&P500 Index has been negative, but is showing early signs of change.
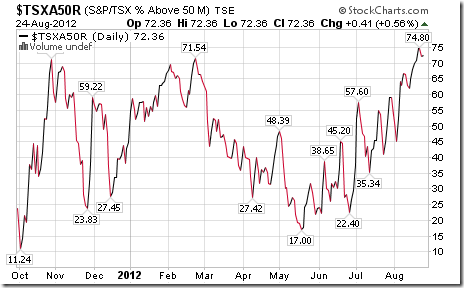
Percent of TSX stocks trading above their 50 day moving average increased last week to 72.36% from 69.92%. Percent is intermediate overbought above the 70% level. Peaks from above the 70% level normally lead to at least a short term correction by the Index.
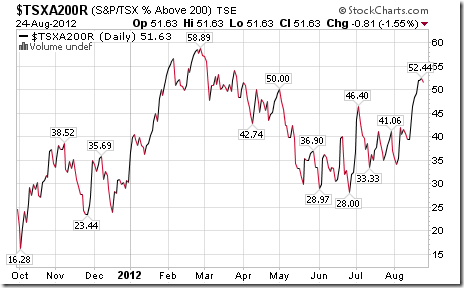
Percent of TSX stocks trading above their 200 day moving average increased last week to 51.63% from 48.37%. Percent is intermediate overbought.
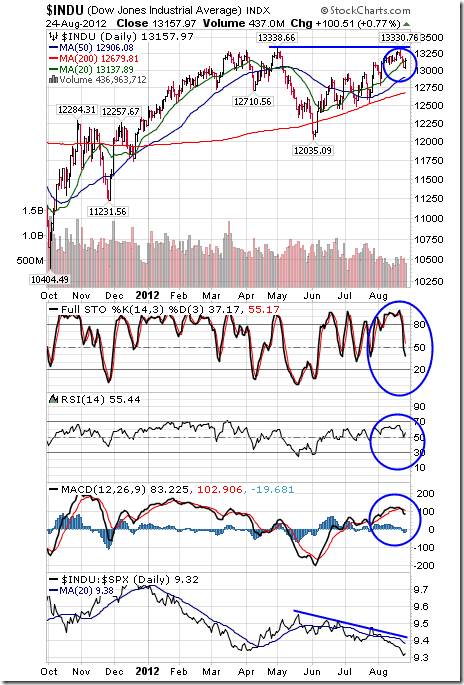
The Dow Jones Industrial Average fell 117.23 points (0.88%) last week. Intermediate trend is up. Resistance is at 13,388.66. The Average briefly fell below its 20 day moving average, but managed to recover above that level on Friday. The Average remains above its 50 and 200 day moving averages. Short term momentum indicators are trending down from an overbought level. Strength relative to the S&P 500 Index remains negative.
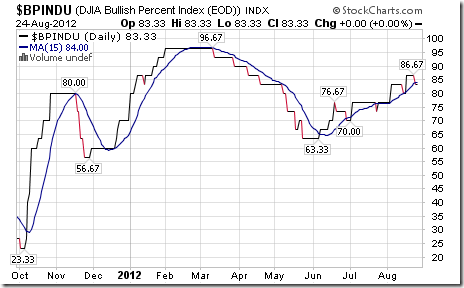
Bullish Percent Index for Dow Jones Industrial Average stocks slipped last week to 83.33% from 86.67% and eased below its 15 day moving average. The Index is intermediate overbought and showing signs of rolling over.
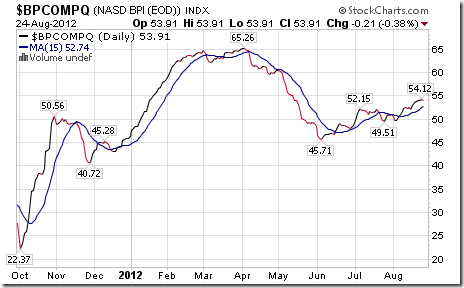
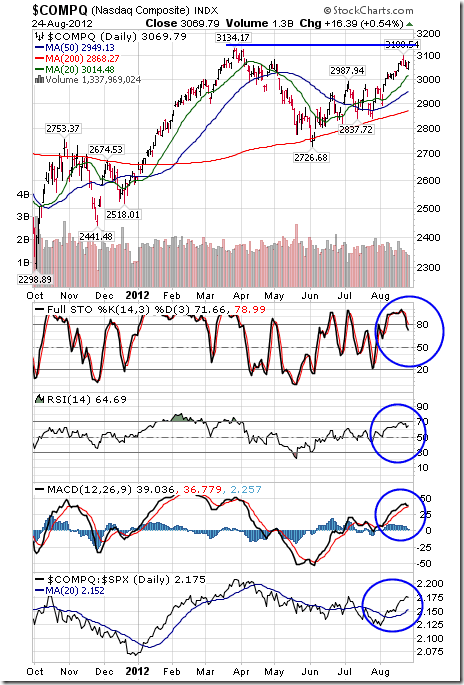
Bullish Percent Index for NASDAQ Composite stocks increased last week to 53.91% from 53.59% and remained above its 15 day moving average. The Index remains intermediate overbought.
The NASDAQ Composite Index slipped 5.80 points (0.19%) last week. Intermediate trend is up. Resistance is at 3,134.17. The Index remains above its 20, 50 and 200 day moving averages. Short term momentum indicators are overbought and showing early signs of rolling over. Strength relative to the S&P 500 Index has turned positive.
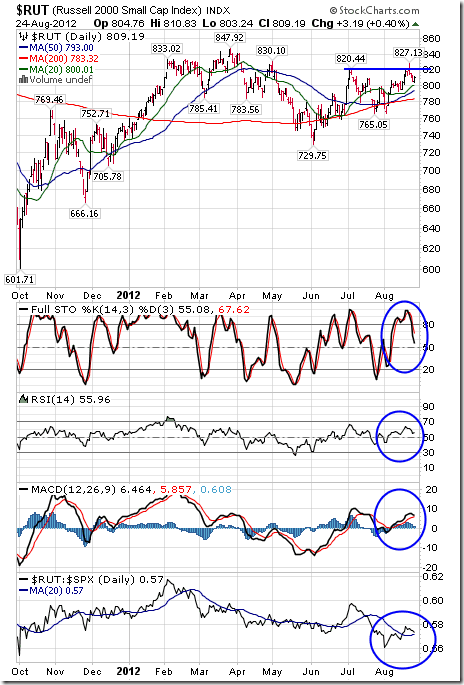
The Russell 2000 Index fell 10.70 points (1.31%) last week. Intermediate trend changed from down to up on a break above resistance at 820.44. The Index remains above its 20, 50 and 200 day moving averages. Short term momentum indicators have rolled over from overbought levels. Strength relative to the S&P 500 Index recently turned neutral/positive.
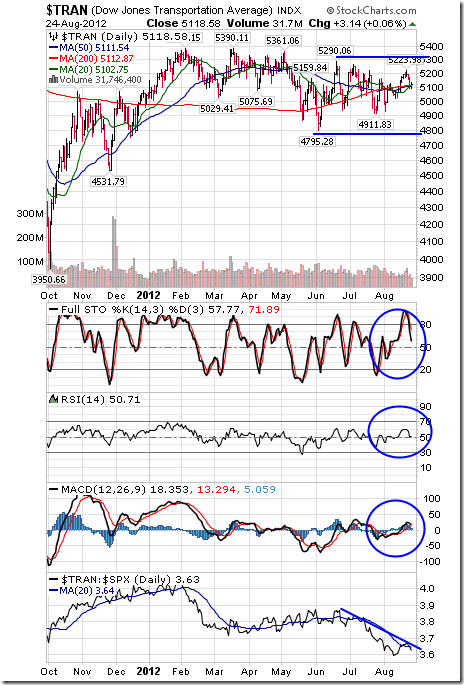
The Dow Jones Transportation Average fell 75.80 points (1.46%) last week. Intermediate trend is down. Support is at 4,795.28 and resistance is at 5,290.06. The Average is just above its 20, 50 and 200 day moving averages. Short term momentum indicators have rolled over from overbought levels. Strength relative to the S&P 500 Index remains negative.
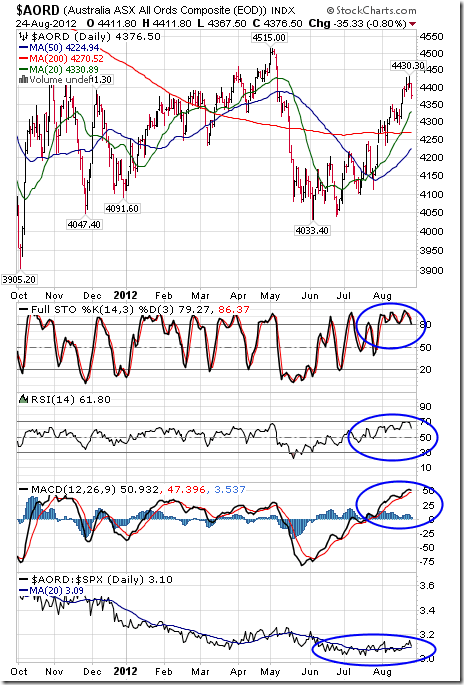
The Australia All Ordinaries Composite Index slipped 17.32 points (0.40%) last week. Intermediate trend is down. Resistance is at 4,515.00. The Index remains above its 20, 50 and 200 day moving averages. Short term momentum indicators are overbought. Strength relative to the S&P 500 Index remains neutral.
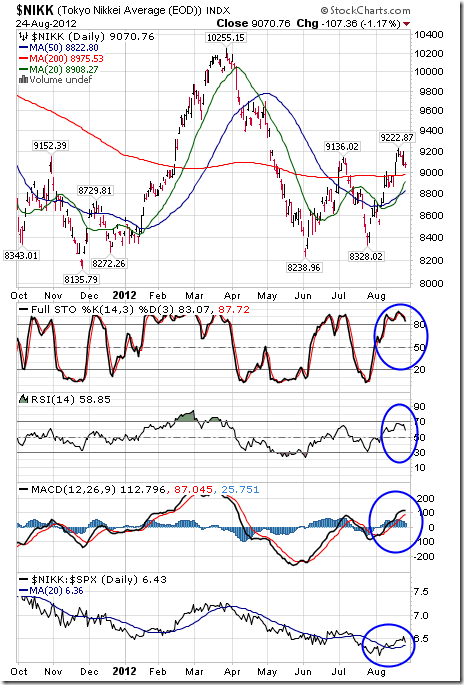
The Nikkei Average fell 91.74 points (1.00%) last week. Intermediate trend is up. The Average remains above its 20, 50 and 200 day moving averages. Short term momentum indicators are overbought. Strength relative to the S&P 500 Index has turned positive.
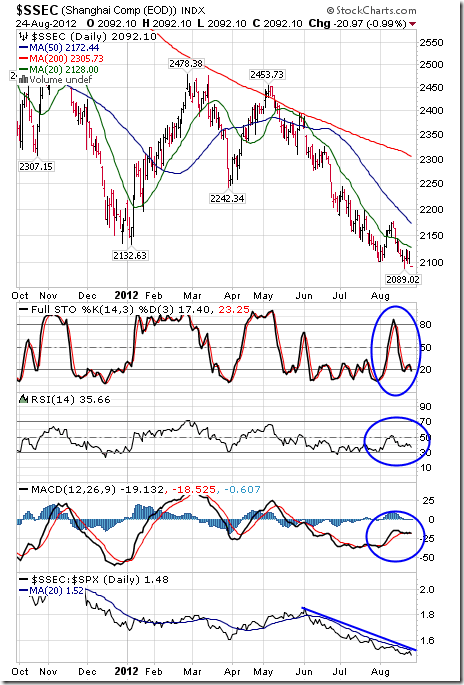
The Shanghai Composite Index fell another 22.79 points (1.08%) to close at a three year low. Intermediate trend is down. The Index remains below its 20, 50 and 200 day moving averages. Short term momentum indicators are trending down. Strength relative to the S&P 500 Index remains negative.
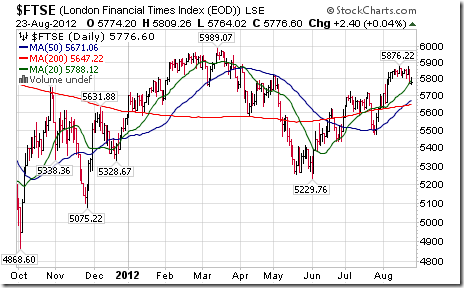
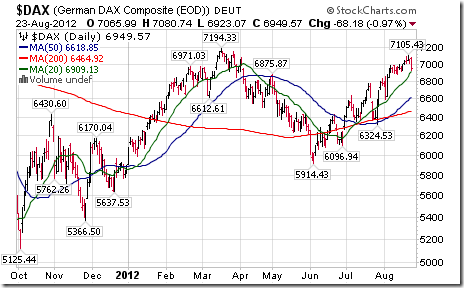
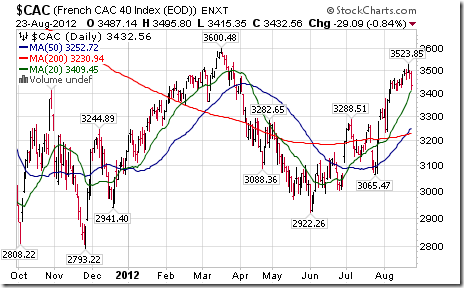
The London FT Index fell 75.82 points (1.30%), the Frankfurt DAX Index dropped 91.31 points (1.30%) and the Paris CAC Index gave up 55.82 points (1.60%) last week.
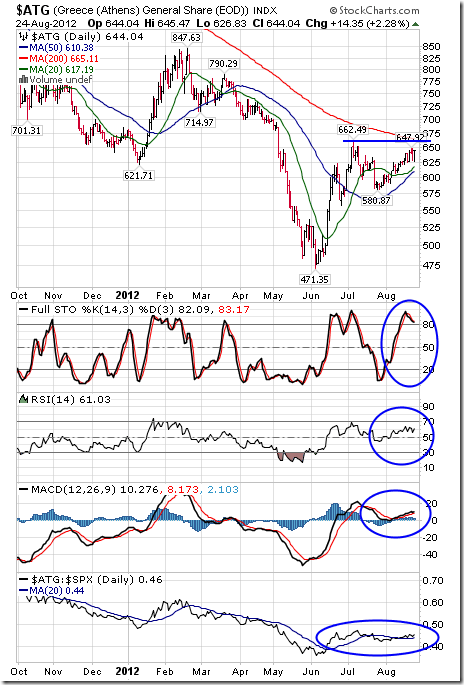
The Athens Index added 4.77 points (0.75%) last week. The Index remains above its 20 and 50 day moving average, but below its 200 day moving average. Short term momentum indicators are overbought. Strength relative to the S&P 500 Index remains neutral.
Currencies
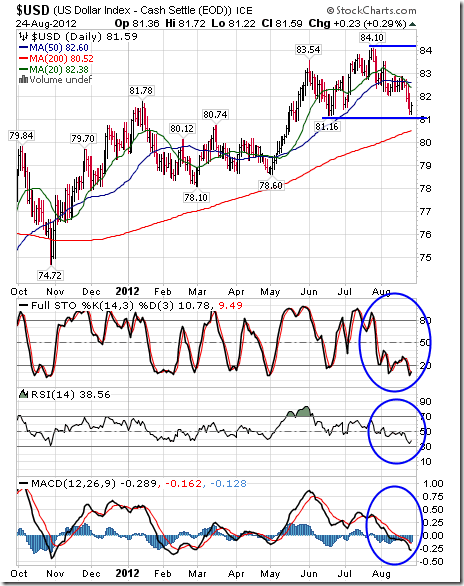
The U.S. Dollar Index lost 1.01 (1.22%) last week. Intermediate trend is up. Support is at 81.16 and resistance is at 84.10. The Index remains below its 20 and 50 day moving averages and above its 200 day moving average. Short term momentum indicators are oversold, but have yet to show signs of bottoming.
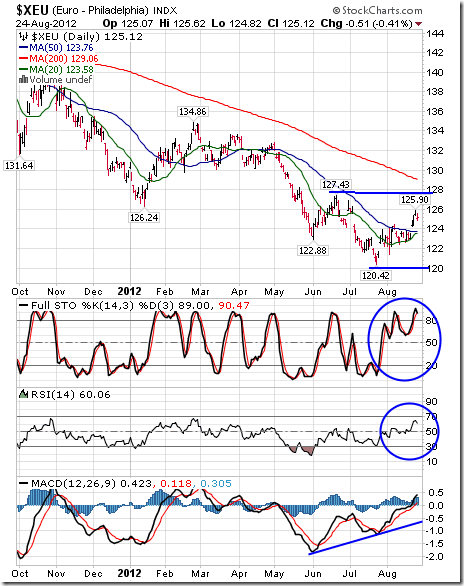
The Euro added 1.80 (1.46%) last week in anticipation of news by the European Central Bank to be announced at the end of the week at the Jackson Hole Conference. Intermediate trend is down. Support is at 120.42 and resistance is at 127.43. The Euro moved above its 50 day moving average last week, but remains below its 200 day moving average. Short term momentum indicators are overbought, but have yet to show signs of peaking.
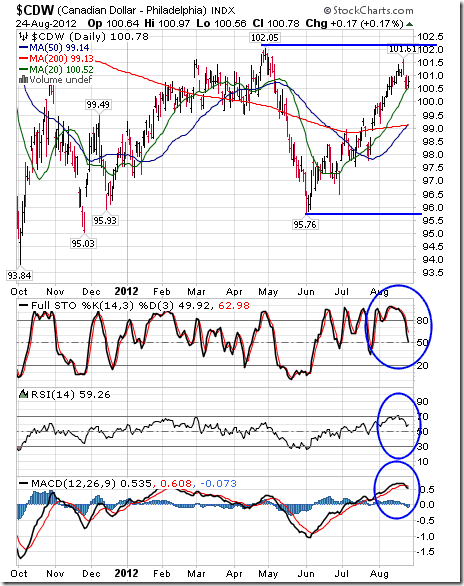
The Canadian Dollar slipped 0.30 cents U.S. (0.30%) last week. Intermediate trend is down. Short term trend is up. The Dollar remains above its 20, 50 and 200 day moving averages. Short term momentum indicators have rolled over from overbought levels.
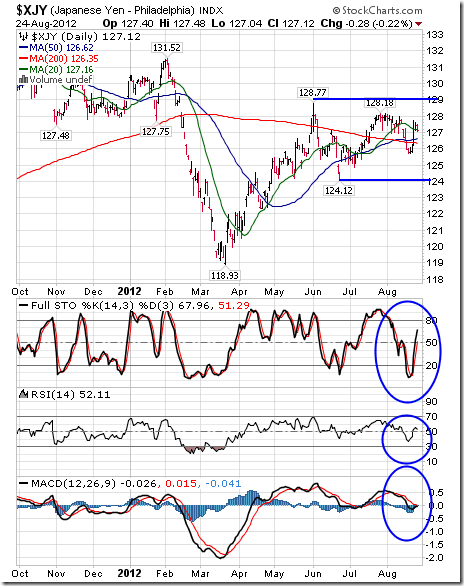
The Japanese Yen added 1.44 (1.15%) last week. Intermediate trend is down. Short term trend is up. Support is at 124.12 and resistance is at 128.77. The Yen remains above its 20, 50 and 200 day moving averages. Short term momentum indicators are neutral.
Commodities
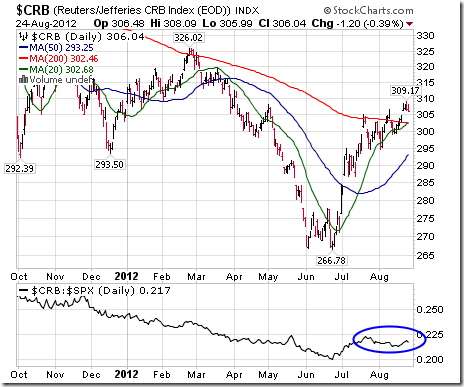
The CRB Index added 2.56 points (0.84%) last week reflecting weakness in the U.S. Dollar Index. Intermediate trend is up. The Index remains above its 20, 50 and 200 day moving averages. Strength relative to the S&P 500 Index remains neutral.
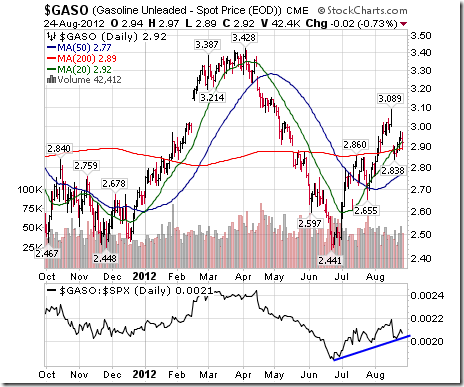
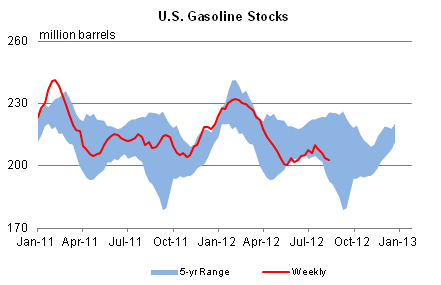
Gasoline added $0.02 (0.69%) last week. Gasoline remains at or above its 20, 50 and 200 day moving averages. Strength relative to the S&P 500 Index remains positive.
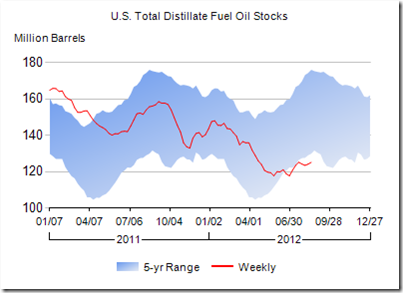
Refined product prices normally weaken in fall, but not this year. U.S. inventories of gasoline and heating oil are at or below their five year average.
In addition, the fifth largest refineries in the world (in Venezuela) literally blew up over the weekend. At least 26 people were killed. Largest export customer for its products is the U.S.
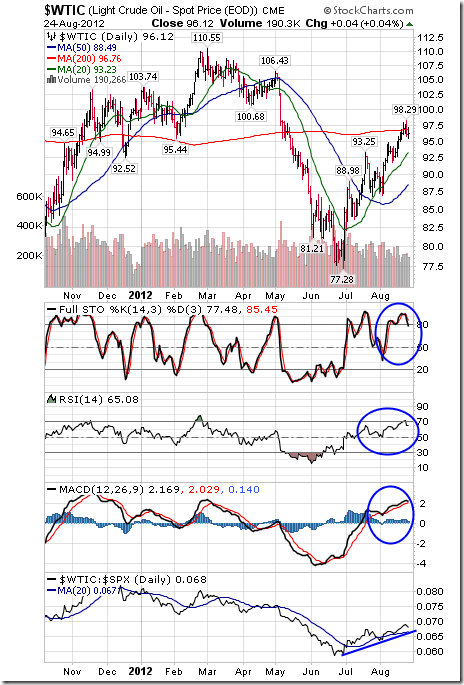
Crude oil added $0.35 (0.37%) last week. Intermediate trend is up. Crude remains above its 20 and 50 day moving averages and is testing its 200 day moving average. Short term momentum indicators are intermediate overbought. Strength relative to the S&P 500 Index remains positive.
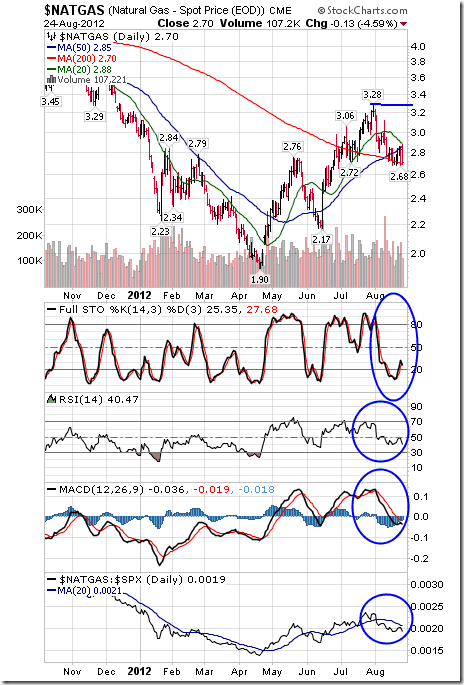
Natural Gas slipped another $0.03 per MBtu (1.10%) last week. Intermediate trend is up. Resistance has formed at $3.28. Gas remains below its 20 day moving average and fell below its 50 day moving average last week. Short term momentum indicators are trending down. Stochastics already are oversold. Strength relative to the S&P 500 Index has turned negative.
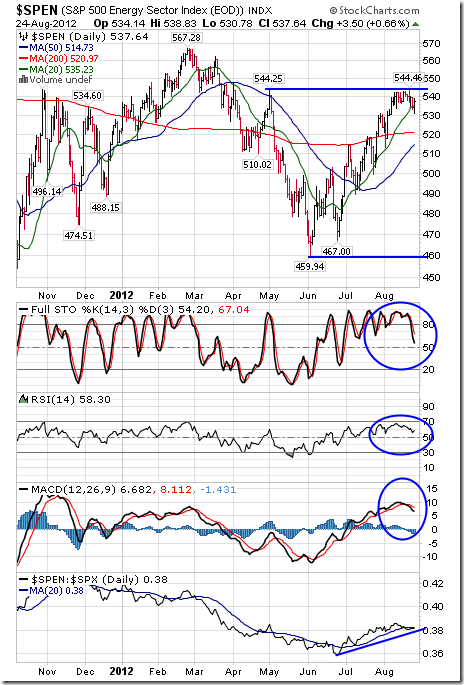
The S&P Energy Index slipped 3.68 points (0.68%) last week. Intermediate trend is up. The Index briefly moved above resistance at 544.25 last week. The Index remains above its 20, 50 and 200 day moving averages. Short term momentum indicators are rolling over from overbought levels. Strength relative to the S&P 500 Index remains positive.
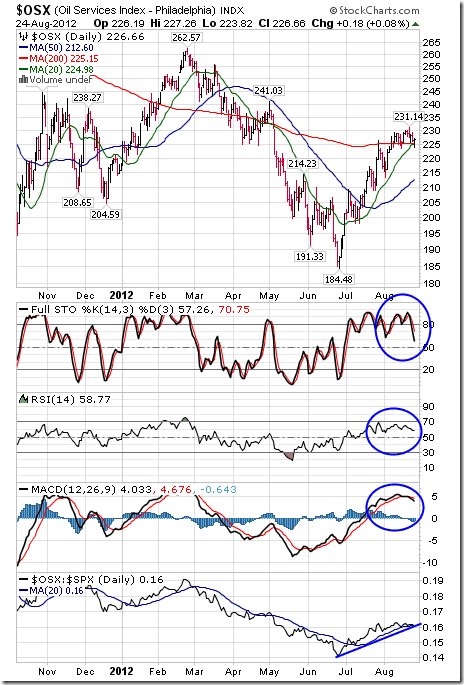
The Philadelphia Oil Services Index added 3.19 points (1.39%) last week. The move above a reverse head and shoulders pattern continues. The Index remains above its 20, 50 and 200 day moving averages. Short term momentum indicators are overbought and have rolled over. Strength relative to the S&P 500 Index remains positive.
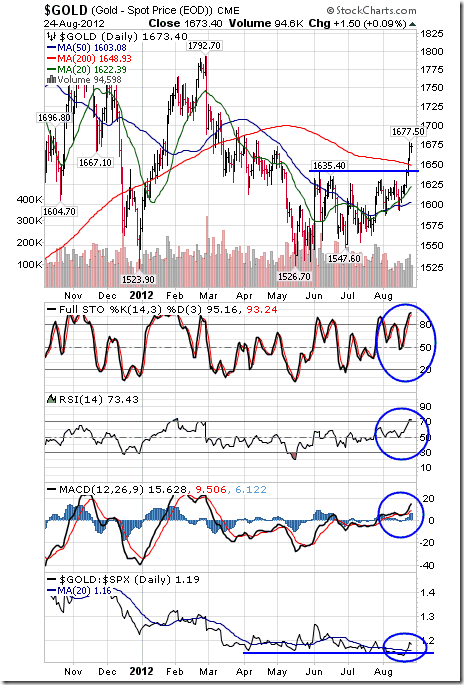
Gold gained $55.90 per ounce (3.46%) last week. Intermediate trend changed from down to up on a break above resistance at $1,642.40. Gold remains above its 20 and 50 day moving averages and moved above its 200 day moving average last week. Short term momentum indicators are short term overbought, but have yet to show signs of peaking. Strength relative to the S&P 500 Index turned from neutral to positive.
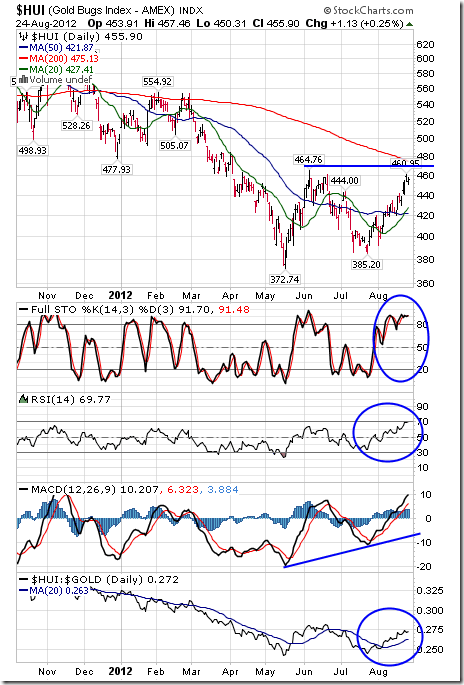
The AMEX Gold Bug Index added 20.87 points (4.88%) last week. Intermediate trend is down. Short term trend is up. Intermediate resistance is at 464.76. The Index remains above its 20 and 50 day moving averages and just below its 200 day moving averages. Short term momentum indicators are overbought, but have yet to show signs of peaking. Strength relative to gold remains positive.
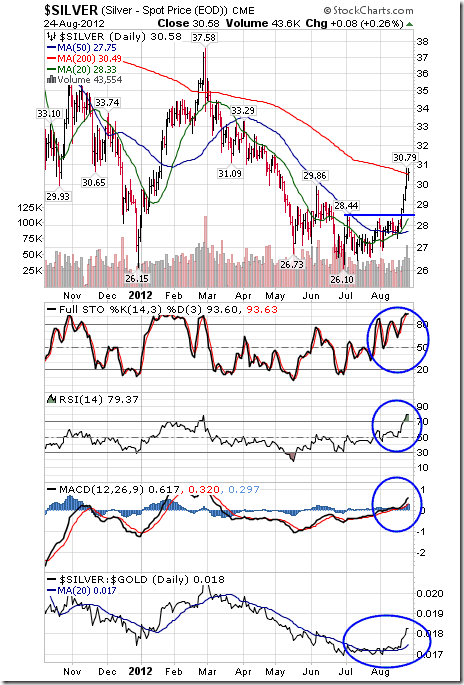
Silver added $2.52 per ounce (8.98%) last week. Intermediate trend changed from down to up on a break above resistance at $28.44. Silver remains above its 20 and 50 day moving averages and moved above its 200 day moving average. Short term momentum indicators are overbought, but have yet to show signs of peaking. Strength relative to gold turned from neutral to positive
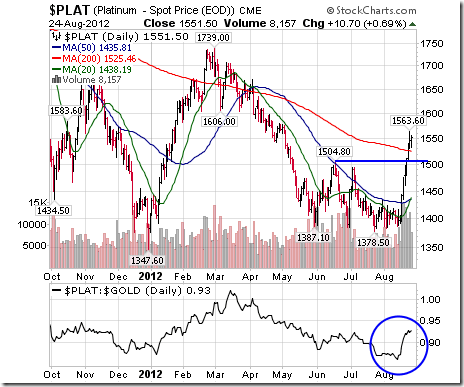
Platinum gained another $81.00 per ounce (5.51%) last week. It broke above resistance at $1,504.80. Strength relative to gold recently turned from negative to positive.
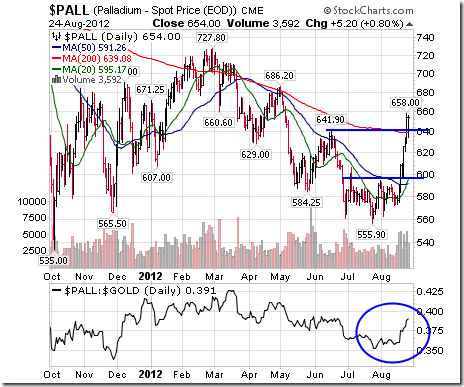
Ditto for Palladium! It gained $71.25 per ounce (12.23%) last week. Resistance at $641.90 was broken. Strength relative to gold also has turned positive.
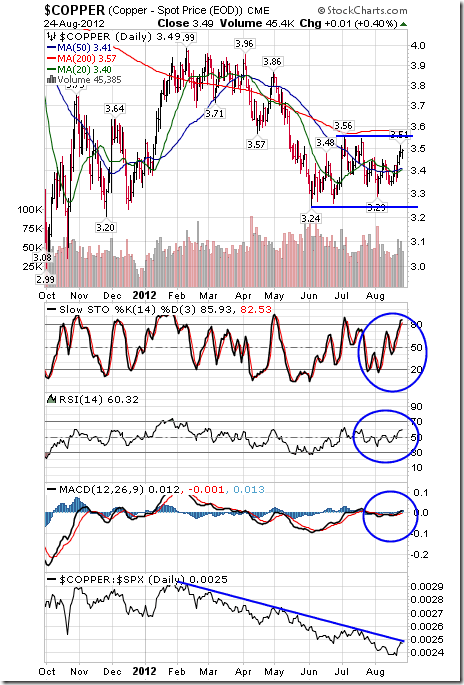
Copper gained $0.08 per lb. (2.35%) last week. Intermediate trend is down. Support is at $3.24 and resistance is at $3.56. Copper remains above its 20 and 50 day moving averages and below its 200 day moving average. Short term momentum indicators are trending up. Strength relative to the S&P 500 Index remains negative, but showing early signs of change.
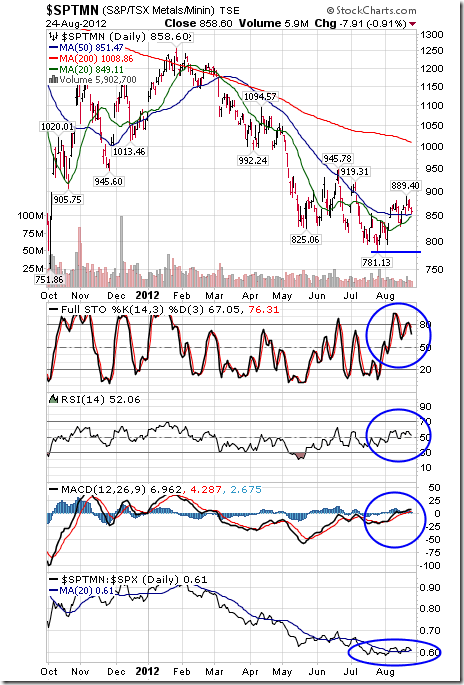
The TSX Global Metals & Mining Index fell 7.02 points (0.81%) last week despite strength in precious metal and copper prices. Intermediate trend is down. The Index remains above its 20 and 50 day moving averages, but below its 200 day moving average. Short term momentum indicators are showing early signs of rolling over. Strength relative to the S&P 500 remains neutral.
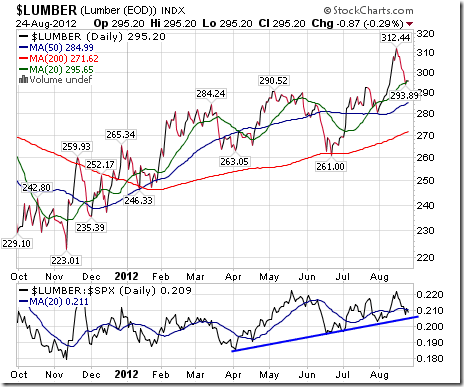
Lumber fell $12.58 (4.09%) last week. It remains above its 50 and 200 day moving averages, but fell below its 20 day moving average on Friday. Strength relative to $SPX is turning negative.
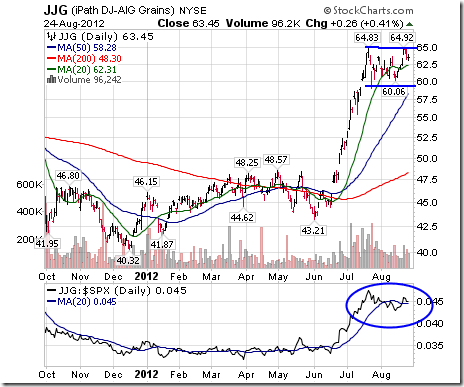
The Grain ETF added $1.35 (2.17%) last week. Units briefly reached a new high. Units are above their 20, 50 and 200 day moving averages. Strength relative to $SPX is negative/neutral.
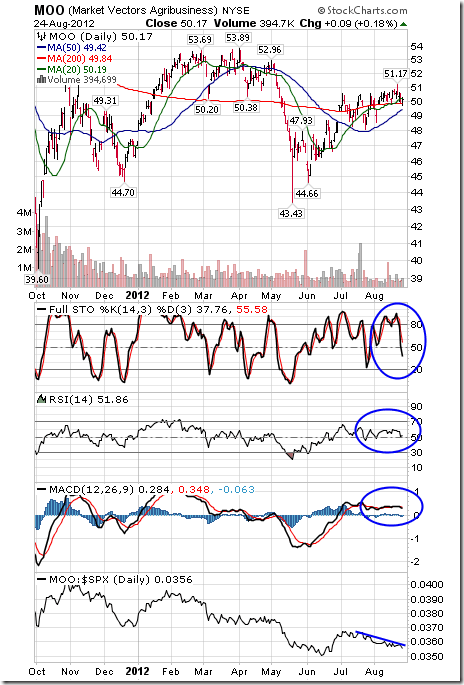
The Agriculture ETF slipped $0.46 (0.91%) last week. Intermediate trend is up. However, units fell below their 20 day moving average, short term momentum indicators have rolled over from an overbought level and strength relative to the S&P 500 Index remains negative.
Interest Rates
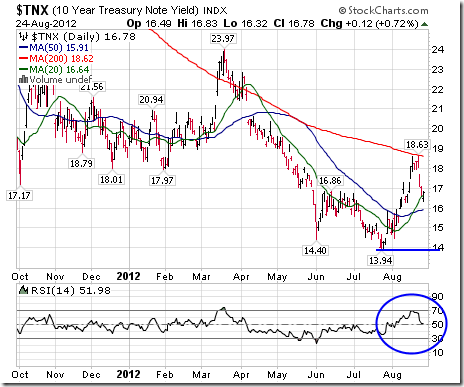
The yield on 10 year Treasuries fell 13.8 basis points (7.60%) last week. Yield remains below its 200 day moving average and briefly fell below its 20 day moving average. Short term momentum indicators have rolled over from overbought levels and are trending down.
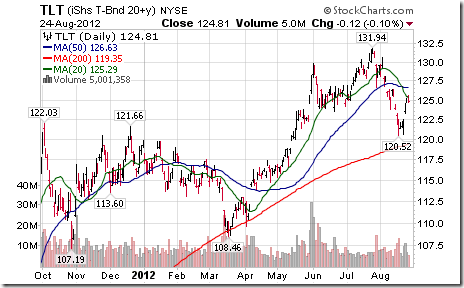
Conversely, price of the long term Treasury ETF gained $3.21 (2.64%) last week.
Other Issues
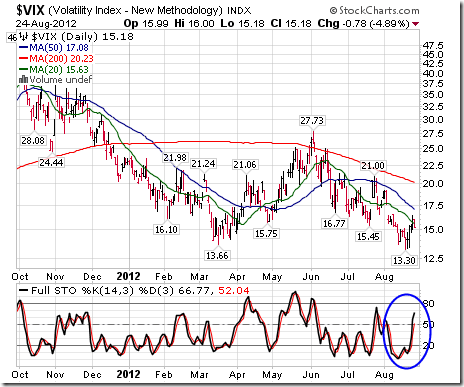
The VIX Index jumped 1.73 (12.9%) last week. Short term momentum indicators are trending higher from oversold levels.
The earnings focus this week is on the Canadian banks. Look for modest gains on a year-over-year basis. At least two of the banks are expected to increase their dividend.
Economic reports this week are expected to have a mildly negative impact on equity markets (Consumer confidence, Chicago PMI, Michigan consumer sentiment).
Macro news heats up this week. The focus is on Bernanke’s speech next Friday at 10:00 AM EDT and Draghi’s speech on Saturday morning. Other events to watch include Eurozone consumer confidence on Thursday and China’s PMI next Saturday (estimated to fall from 50.1 to 49.8).
Short and intermediate technical indicators for most equity markets and sectors are overbought and are showing signs of rolling over. Mary Ann Bartels, Merrill Lynch’s technical analyst predicted downside risk by the S&P 500 between now and the end of September at 8-10%. Following is a link from CNBC to her video: http://www.cnbc.com/id/48756751
North American equity markets have a history of moving lower from the beginning of September to mid-October during a U.S. Presidential election year (particularly when polls show a close race. Thereafter, equity markets move higher regardless of who wins.
September is the weakest month of the year for North American equity markets. This is the month that analysts review their estimates for the current year, realize their estimates are too high and revise them accordingly. History is about to repeat.
Other issues that could impact equity markets include Hurricane Isaac, the Republican convention and increasing media comments about the possibility of Israel attacking Iran before the Presidential election.
Cash on the sidelines on both sides of the border is substantial and growing. Bank of Canada’s Mark Carney highlighted the situation in Canada last week. However, political uncertainties (including the Fiscal Cliff) preclude major commitments by investors and corporations before the Presidential election.
The Bottom Line
Equity markets on both sides of the border have had a good ride since their lows on June 4th. Now they are showing short and intermediate technical signs of an intermediate peak. It’s time to take profits in selected seasonal trades such as agriculture and leisure & entertainment. Other seasonal trades such as energy and gold have additional intermediate upside potential, but no longer are buy candidates. A cautious stance appears appropriate until the second half of October when upside opportunities are expected to re-appear.
Tom Rogers’ Weekly Elliott Wave Blog
Following is a link:
http://www.tomrogers.net/signpost.htm
Special Free Services available through www.equityclock.com
Equityclock.com is offering free access to a data base showing seasonal studies on individual stocks and sectors. The data base holds seasonality studies on over 1000 big and moderate cap securities and indices.
To login, simply go to http://www.equityclock.com/charts/
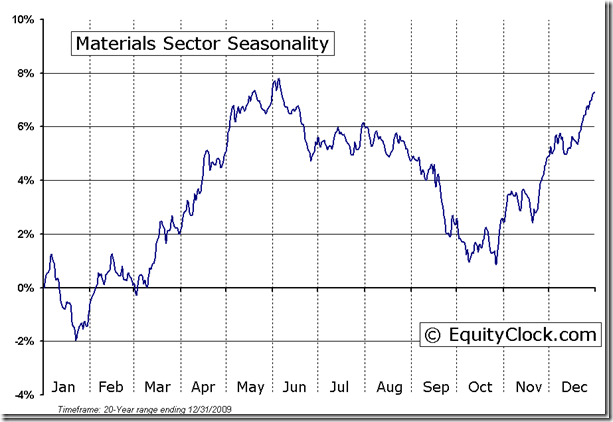
Following is an example:
Materials Sector Seasonal Chart
ETF News
The latest weekly update on ETFs in Canada to August 24th is available at

Location: Rimrock Hotel, Banff Canada http://www.rimrockresort.com/
About the Conference: Guest speaker topics will include grains, Oil, Natural Gas, Precious and Industrial Metals trading. Incorporating the information from commodity related stocks and ETF’s will be a specific study for traders to expand their understanding. The speaker list includes Internationally famous technicians who have presented world wide, authored numerous books and trading systems: Jordan Kotick -Barclays Head of Technical Strategy, David Keller -Fidelity Mana ging Director of Research, Tom McLellan -McLellan Financial Publications and the McLellan Oscillator, Alan Knuckman -Agora Financial Resources Traders, Martin Pring -Pring Turner Capital Group, Don Vialoux -Techtalk, Paul Ciana -Bloomberg, Adam Sorab -CQS Management Limited, Jeffrey Kennedy -Elliott Wave International (EWI).
Conference Fees:
CSTA/MTA/IFTA Members:
$599.00
Non-Members:
$699.00
For more information and to reserve a spot, please visit the following link:https://store.csta.org/event_registration.php?key=605
Disclaimer: Comments and opinions offered in this report at www.timingthemarket.ca are for information only. They should not be considered as advice to purchase or to sell mentioned securities. Data offered in this report is believed to be accurate, but is not guaranteed.
Don and Jon Vialoux are research analysts for Horizons Investment Management Inc. All of the views expressed herein are the personal views of the authors and are not necessarily the views of Horizons Investment Management Inc., although any of the recommendations found herein may be reflected in positions or transactions in the various client portfolios managed by Horizons Investment Management Inc
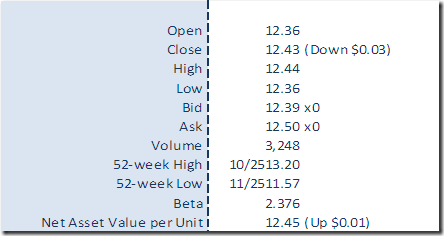
Horizons Seasonal Rotation ETF HAC August 24th 2012


