by Don Vialoux, TimingtheMarket.ca
(Editor’s Note: Mr. Vialoux is scheduled to appear on BNN’s Market Call today at 1:00 PM)
Interesting Chart
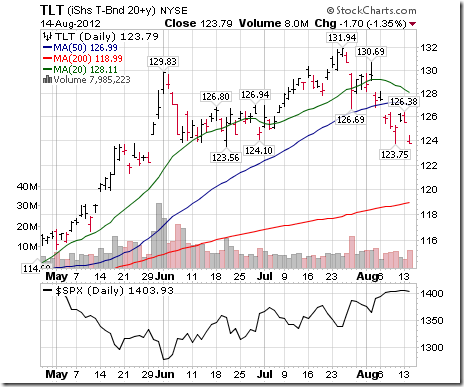
U.S. long term bond prices have come under significant pressure during the past three weeks. Weakness comes at a time when U.S. equity markets have been moving higher. Early evidence that investors are switching from low yield Treasuries into higher yield equities!
Special Free Services available through www.equityclock.com
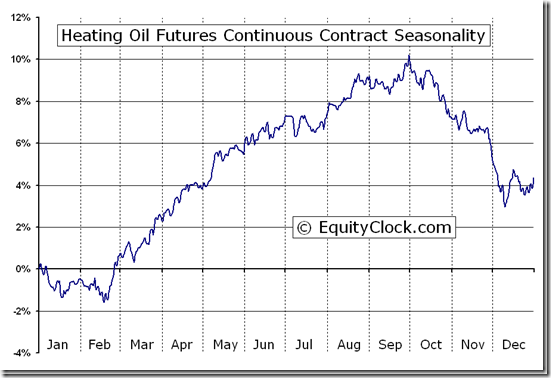
Equityclock.com is offering free access to a data base showing seasonal studies on individual stocks and sectors. The data base holds seasonality studies on over 1000 big and moderate cap securities and indices.
To login, simply go to http://www.equityclock.com/charts/
Following is an example:
Heating Oil Futures (HO) Seasonal Chart
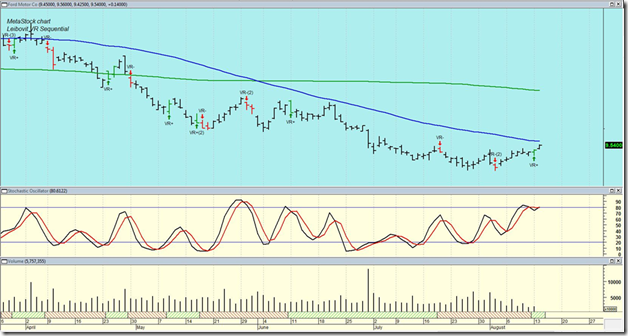
Example of a Leibovit Volume Reversal Signal on Ford
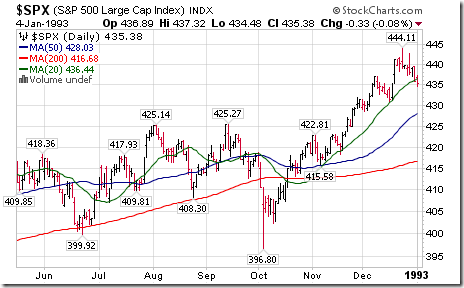
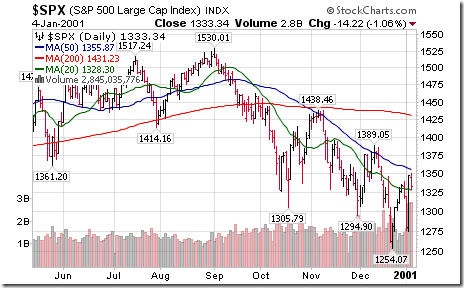
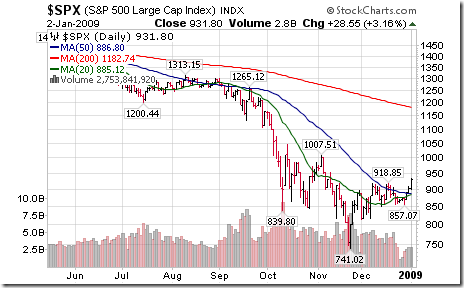
S&P 500 Index during Presidential Election Years When The Race Is Close By Mid-August
Recent election polls show that the race this year is close. Similar situations occurred in 1992, 2000 and 2008. Following are charts for those years. Notice the tendency for U.S. equity markets to move lower from August to October followed by an upside move following the election. History is about to repeat.
Disclaimer: Comments and opinions offered in this report at www.timingthemarket.ca are for information only. They should not be considered as advice to purchase or to sell mentioned securities. Data offered in this report is believed to be accurate, but is not guaranteed.
Don and Jon Vialoux are research analysts for Horizons Investment Management Inc. All of the views expressed herein are the personal views of the authors and are not necessarily the views of Horizons Investment Management Inc., although any of the recommendations found herein may be reflected in positions or transactions in the various client portfolios managed by Horizons Investment Management Inc
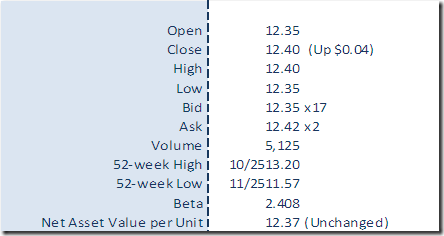
Horizons Seasonal Rotation ETF HAC August 14th 2012


