by Don Vialoux, EquityClock.com
Upcoming US Events for Today:
- Retail Sales for July will be released at 8:30am. The market expects an increase of 0.3% versus a decline of 0.5% previous. Excluding Autos, the market expects an increase of 0.4% versus a decline of 0.4% previous.
- Producer Price Index for July will be released at 8:30am. The market expects an increase of 0.2% versus an increase of 0.1% previous. Core PPI is expected to increase by 0.2%, consistent with the previous report.
- Business Inventories for June will be released at 10:00am. The market expects an increase of 0.2% versus an increase of 0.3% previous.
Upcoming International Events for Today:
- French GDP for the Second Quarter will be released at 1:30am EST. The market expects a year-over-year increase of 0.2% versus an increase of 0.3% previous.
- German GDP for the Second Quarter will be released at 2:00am EST. The market expects a year-over-year increase of 1.0% versus an increase of 1.2% previous.
- Great Britain Consumer Price Index for July will be released at 4:30am EST. The market expects a year-over-year increase of 2.3% versus 2.4$ previous.
- Euro-Zone GDP for the Second Quarter will be released at 5:00am EST. The market expect a year-over-year decline of 0.5% versus no change (0.0%) previous.
- German Economic Sentiment Survey for August will be released at 5:00am EST. The market expects –18.5 versus –19.6 previous.
Recap of Yesterday’s Economic Events:

The Markets
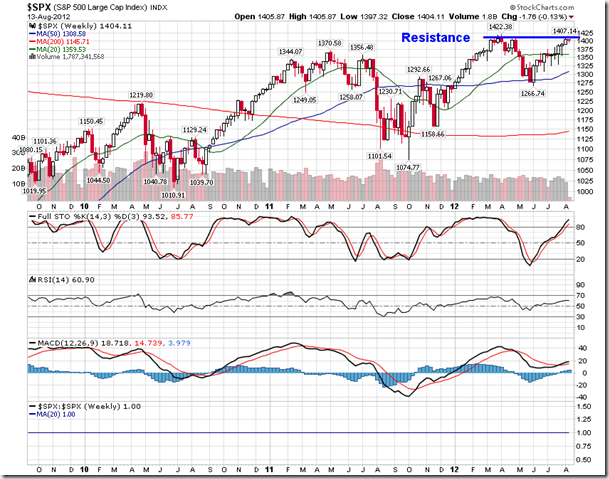
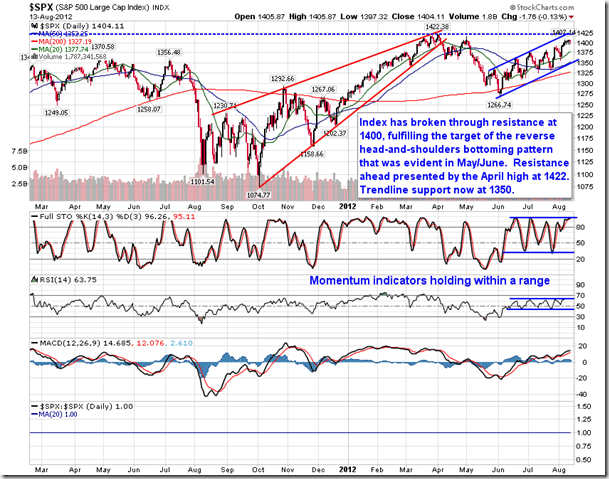
Equity markets traded mixed on Monday during a low volume session that saw the S&P 500 trade on either side of the 1400 mark. Volume has been a significant factor in recent trade, showing some of the lowest levels in years. Monday was no different with the S&P 500 ETF (SPY) showing the lowest volume day since April 25th 2011, approximately the 2011 peak. Volume has clearly been problematic as it provides evidence of a lack of conviction to equities; investors are showing no impetus to buy or sell. Investors are clearly waiting for a catalyst, preferably in the form of central bank easing to give equities a quick boost, despite how bad economic fundamentals get. The sustainability of this is obviously questionable.
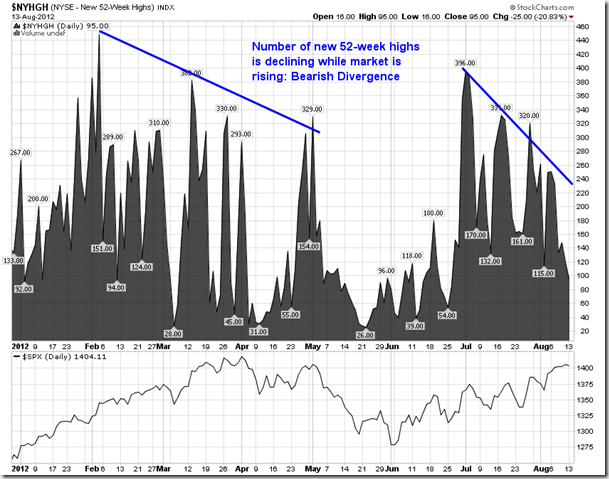
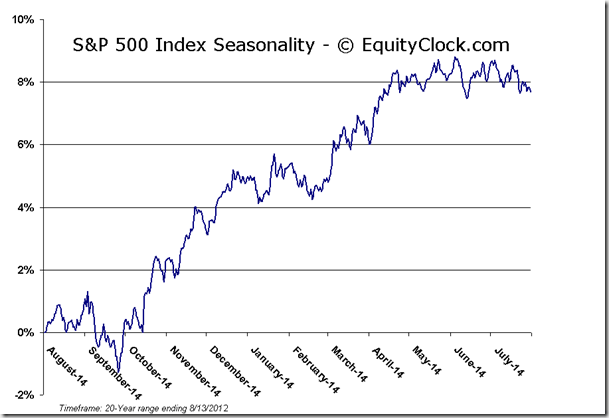
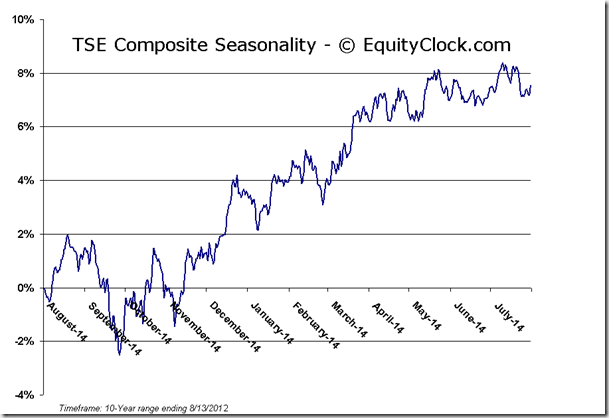
Equity markets have had a substantial run since the low set at the beginning of June. The S&P 500 has added over 140 points from the low of 1266 to the recent high of 1407. Resistance is now at hand, as presented by the March and April peaks. Reaction to this peak will be critical in determining the strength behind this market. Rejection from this level could chart a double top, which would likely follow with a significant selloff. A healthy breakout, ideally accompanied by a pickup in volume, could see the continuation of this rally into the fall, a period that is typically negative on a seasonal basis. An increase in the number of stocks breaking out to new 52-week highs is an ideal tell to hint of a breakout to come. Unfortunately, the number of stocks breaking to new 52-week highs has been declining since the start of July, a situation similar to what was realized from February through April of this year in which equity market trends remained positive, but momentum deteriorated prior to a peak. This divergence compared to recent price activity could be warning of a near-term peak in equities.
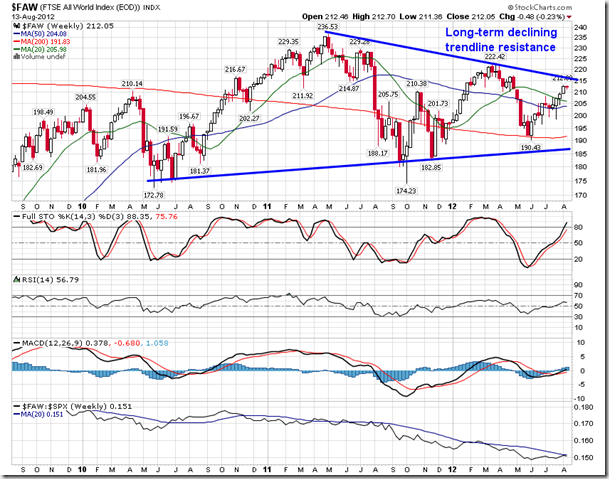
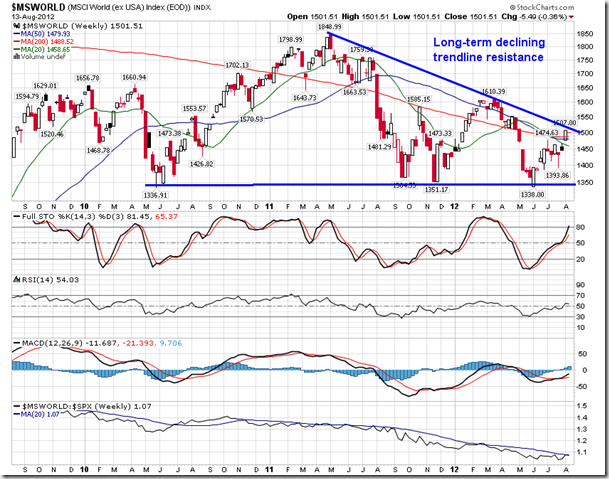
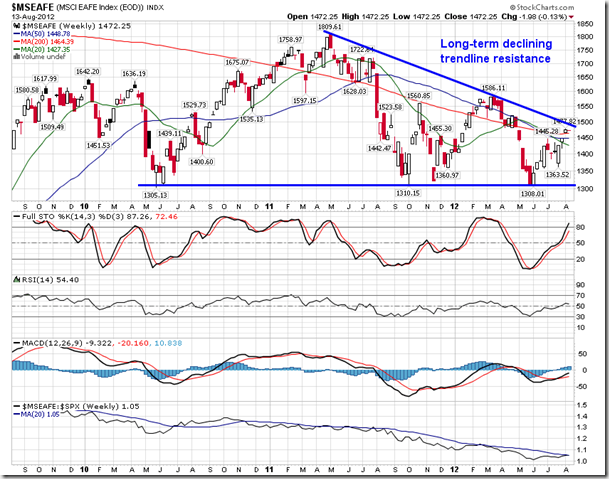
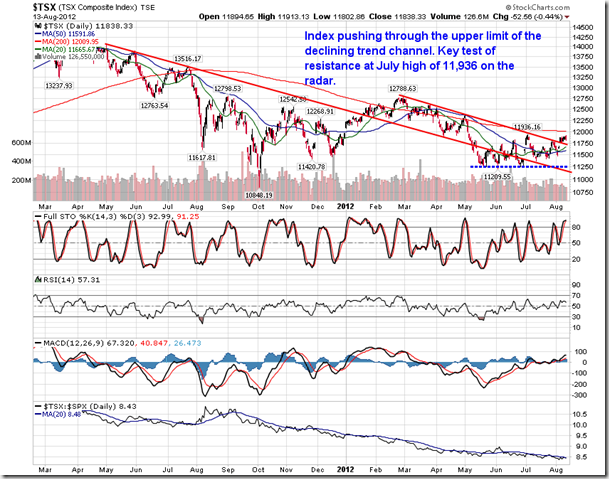
World equity benchmarks are also approaching a level of resistance presented by a declining long-term trendline. Reaction to this point of resistance is expected, potentially bringing an end to the bullish rally that has remained intact for two and a half months. Descending triangle patterns, potentially a bearish setup, can also be derived from the charts, suggesting negative things ahead for equities. June’s lows will be critical point to watch upon any pullback from the recent intermediate positive trend.
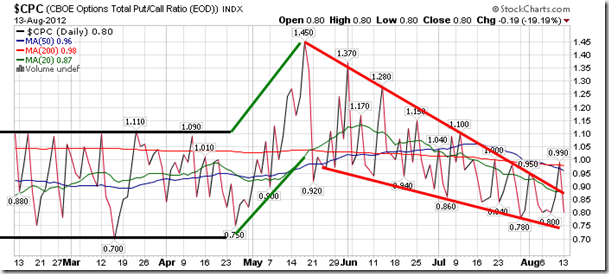
Sentiment on Monday, as gauged by the put-call ratio, ended bullish at 0.80. The ratio is back within the bounds of the falling wedge pattern.
Chart Courtesy of StockCharts.com
Chart Courtesy of StockCharts.com
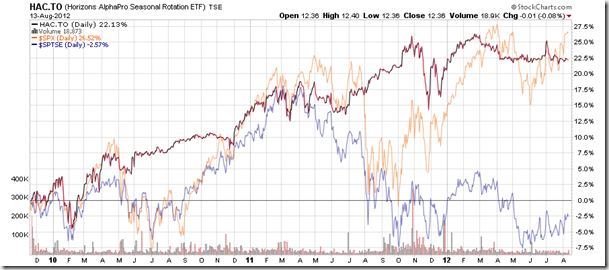
Horizons Seasonal Rotation ETF (TSX:HAC)
- Closing Market Value: $12.36 (down 0.08%)
- Closing NAV/Unit: $12.37 (down 0.15%)
Performance*
| 2012 Year-to-Date | Since Inception (Nov 19, 2009) | |
| HAC.TO | 1.56% | 23.7% |
* performance calculated on Closing NAV/Unit as provided by custodian
Click Here to learn more about the proprietary, seasonal rotation investment strategy developed by research analysts Don Vialoux, Brooke Thackray, and Jon Vialoux.
Copyright © EquityClock.com


