by Richard Shaw, QVM Group, LLC
Over long periods, low volatility stocks have produced both a higher total return and lower volatility (better risk adjusted return and higher absolute return) than broad indexes. This is referred to as the “low volatility anomaly”, because it is contrary to the long held view that more return only comes from taking more risk. There are various theories as to why the anomaly exists, but factual evidence shows that it does.
Over shorter periods, low volatility does not always outperform. No approach always outperforms. As a generality, low volatility tends to lag in rising markets (captures less of the upside move), but to lead in falling markets (captures less of the downside move). Over cycles, that has come out ahead.
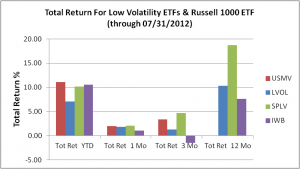
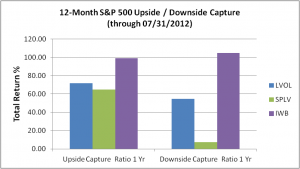
These histograms, using Morningstar Principia data, shows the three key US low volatility ETFs (SPLV, USMV and LVOL) versus the Russell 1000 index ETF (IWB) for total return and for upside and downside market move capture within the past 12 months ending July 31, 2012.
click image to enlarge
Two of the low volatility funds outperformed the Russell 1000 YTD and the low volatility funds outperformed the Russell 1000 over 1 month, 3 months and 12 months.
click image to enlarge
In the past 12 months, the Russell 1000 (IWB)captured 99.10% of the upside movements of the S&P 500 (did a bit better), and captured 104.77% of the S&P 500 downside movements (did worse). The two low volatility ETFs with 12 months of history (LVOL and SPLV) captured 71.81% and 64.92% respectively of the upside, and captured 7.58% and 54.71% of the downside, according to Morningstar, [the 7.58% downside capture figure for SPLV seems like it may be an error, but we expect the capture was lower than the Russell 1000].
The trailing yields on each of the three funds with 12 months of history are:
- IWB: 1.84%
- SPLV: 2.68%
- LVOL: 1.91%
The assets in each fund are:
- IWB: $6,395.2 million
- SPLV: $2,326.7 million
- USMV: $342.0 million
- LVOL: $67.9 million
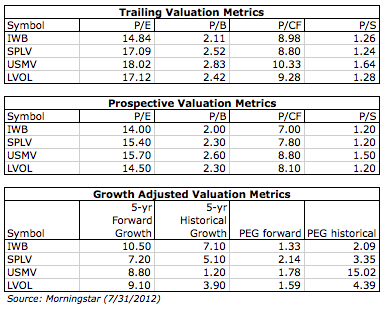
Here are some key valuation metrics for the four funds:
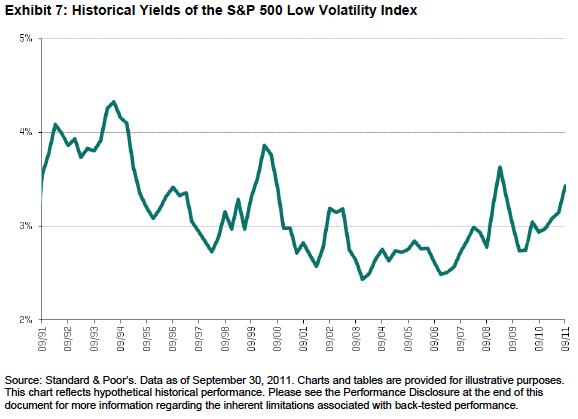
Standard and Poor’s Had This To Say and Illustrate About the Low Volatility Anomaly: (download their report)
“With so much uncertainty in riskier investments, many investors are seeking calmer waters for at least a portion of their portfolios.
The S&P 500 Low Volatility Index comprises the 100 least-volatile stocks in the S&P 500.
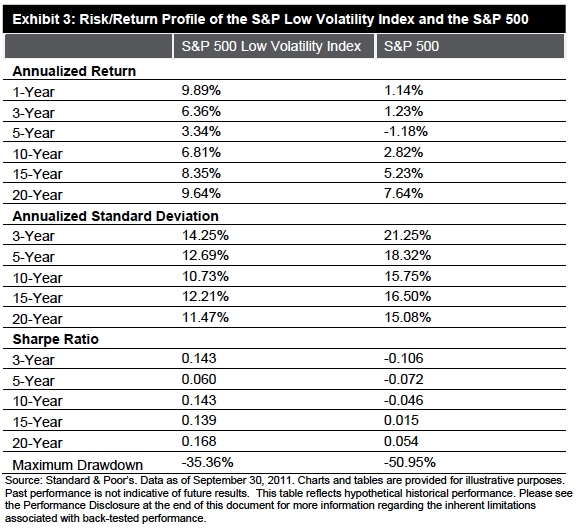
Volatility is measured as the standard deviation of price changes over the trailing 252 days. The 100 securities are then ranked and weighted according to their volatility, with higher weights assigned to less-volatile stocks. The index is rebalanced quarterly. Historical data shows that an index comprising low-volatility securities outperform more-volatile securities by providing better downside protection during volatile periods while offering favorable relative annualized returns.Lower Risk Doesn’t Mean Having to Settle for Lower Returns
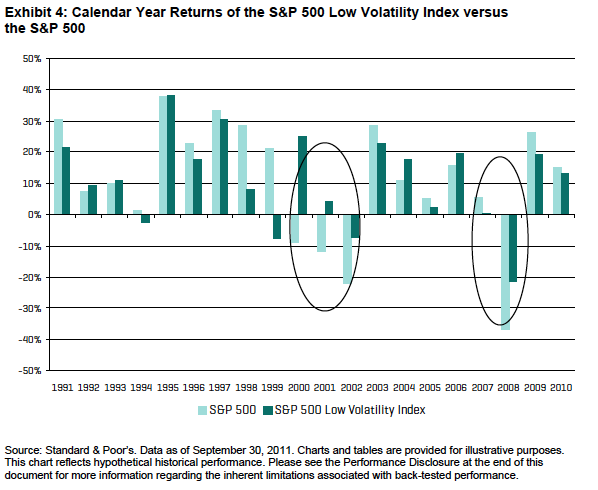
Getting better returns without taking higher risks may seem counterintuitive. However, the simple, yet powerful low-volatility investment approach has resulted in higher relative performance compared to the parent index over a long-term period.In terms of annualized, risk-adjusted returns, the S&P 500 Low Volatility Index outperforms the S&P 500 over near-, medium- and long-term investment horizons.”
The real world problem illustrated by the chart above is that many (perhaps most) investors would have abandoned their low volatility stocks, or fired their low volatility oriented investment manager in the late 1990s due to underperformance, not seeing the outperformance ahead.
Standard and Poor’s Release An Updated Low Volatility Study in August 2012 (download report)
They said,
“Among the long-standing anomalies in modern investment theory, perhaps none are as puzzling and compelling as the low-volatility effect. It challenges the traditional equilibrium asset pricing theory that an asset’s expected return is directly proportional to its beta or systematic risk, or, in other words, higher-risk securities should be rewarded with higher expected returns while lower-risk assets receive lower expected returns.
Contrary to that theory, the empirical evidence of numerous academic studies has illustrated that low-volatility or low-risk investing outperforms the broad market as well as high-risk strategies over a long-term investment horizon with much less realized volatility. In the U.S. equity market, the S&P 500 Low Volatility Index returned 6.95% (10.75% standard deviation) and the MSCI USA Minimum Volatility Index returned 5.1% (12.32% standard deviation) on an annualized basis over the 10 years ended March 31, 2012, with 23% to 30% lower volatility than a market cap-weighted benchmark such as the S&P 500, which returned 4.12% (15.99% standard deviation).”
Russell Investments Says This About the Low Volatility Anomaly: (download their report)
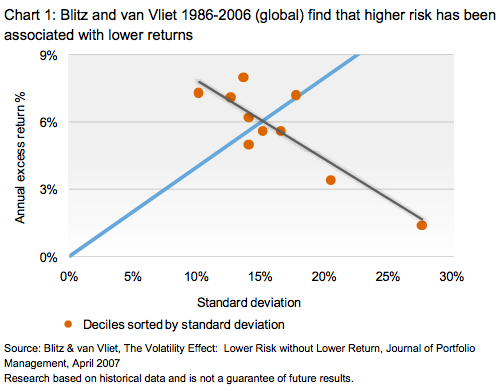
“Intuitively, investors might expect stocks that are less risky than other stocks – stocks we refer to as defensive stocks – to deliver lower returns than the broad market over the long term. … Key findings from the academic research: no evidence of a risk premium for risky stocks.”
They provide this chart hat shows lower return for higher volatility (a higher return for lower volatility) for investments in US stocks from 1986 through 2006.
Copyright (c) QVM Perspectives


