From Eric Sprott & Etienne Bordeleau
The Solution…is the Problem, Part II
When we wrote Part I of this paper in June 2009, the total U.S. public debt was just north of $10 trillion. Since then, that figure has increased by more than 50% to almost $16 trillion, thanks largely to unprecedented levels of government intervention.
Once the exclusive domain of central bankers and policy makers, acronyms such as QE, LTRO, SMP, TWIST, TARP, TALF have found their way into the mainstream. With the aim of providing stimulus to the economy, central planners of all stripes have both increased spending and reduced taxes in most rich countries. But do these fiscal and monetary measures really increase economic activity or do they have other perverse effects?
In today’s overleveraged world, greater deficits and government spending, financed by an expansion of public debt and the monetary base (“the printing press”), are not the answer to our economic woes. In fact, these policies have been proven to have a negative impact on growth.
While it hasn’t received much attention in recent years, a wide body of economic theory suggests that government policies and their size relative to the total economy can have a significant detrimental impact on economic growth. A recent paper from the Stockholm Research Institute of Industrial Economics compiles evidence from numerous empirical studies and finds that, for rich countries, there is overwhelming evidence of a negative relationship between a large government (either through taxes and/or spending as a share of GDP) and economic growth.1 All else being equal, countries where government plays a large role in the economy tend to experience lower GDP growth.
Of course, correlation does not imply causation. While the literature is not definitive on causation, it still provides strong evidence that more taxes and government spending as a share of GDP (except for productive investments such as education) is associated with lower growth.
One exception to these findings is the experience of Scandinavian countries. They have both high taxes and high government spending as a share of GDP but have experienced relatively rapid growth over the past 20 years. However, a significant share of their spending goes to education, which has been found to foster growth. They also counterbalance the large role of the state with very liberal, pro-market reforms and low levels of public debt.2
Debt overhang and economic growth
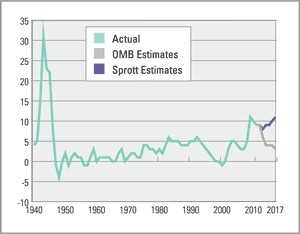
Even if one believes that temporary Keynesian-type fiscal stimulus, in the form of tax breaks and increased government spending, can spur growth in the short-term, these actions inevitably lead to larger deficits and higher government debt (see July 2010 Markets at a Glance, “Fooled By Stimulus”). As Figures 1 and 2 below show, the U.S. Federal Government deficit and debt levels are already at their highest levels since the end of World War II and the scope of future stimulus appears to be rather limited. According to our projections (which assume there will be no fiscal cliff), the U.S. federal debt will increase significantly as the deficit remains sustained and elevated. For many European countries the situation is even worse.
FIGURE 1: U.S. DEFICIT AS A SHARE OF GDP

FIGURE 2: U.S. DEBT-TO-GDP*

Source: The White House: Office of Management and Budget (OMB) and Sprott Calculations
*For reasons discussed in May 2009 Markets at a Glance The Solution … is the Problem, Part 1, we show total federal debt subject to the debt ceiling.
High levels of debt, or debt overhangs, cause more problems. Recent work by Carmen Reinhart and Kenneth Rogoff (Harvard University) demonstrates that banking crises are strongly associated with large increases in government indebtedness, long periods of unemployment and, ultimately, some form of default. They identify a threshold of 90% debt-to-GDP as the trigger to a debt crisis.3 As shown in Figure 2, the U.S. has already passed that threshold.
The historical evidence shows that countries with large governments and high levels of debt have on average, achieved lower economic growth. Given the already high level of debt and deficits in most developed countries, it is doubtful that increased fiscal stimulus will really help the recovery. It’s clear that debt is the problem and the solution does not lie in piling on even more of it. The current debt situation, coupled with the increasing lack of transparency of politically motivated regulations and interventions, leaves little room for a healthy deleveraging of our economies. Here is what central planners have in mind.
Debt overhang resolution and implications for the future
Througout history, high debt-to-GDP ratios have been resolved through five channels:4
- Economic growth
- Austerity
- Defaults
- Sudden bursts of inflation
- Steady financial repression and inflation
Clearly, number one and two are not working right now and, in some European countries, are actually negatively reinforcing each other. The U.S. is facing its homegrown fiscal cliff and political polarization makes its resolution doubtful. Number three seems politically unacceptable for rich, developed nations, which see default as the realm of developing countries. Sudden bursts of inflation are hard to contain and work only so many times as investors, assuming a normal bond market, demand higher interest rates to compensate for inflation risk. Moreover, with interest rates already, at zero it seems that we are left with number five: steady financial repression and inflation. This terminology was first introduced in the early 1970s by Edward Shaw and Ronald McKinnon, both from Stanford University.5
They define financial repression as:
- Explicit or indirect caps or ceilings on interest rates
- The creation and maintenance of a captive domestic audience (i.e.: forced holdings of government debt by financial institutions and pension funds)
- Direct ownership of financial institutions and/or entry restriction in the financial industry (i.e.: China, India)
We are clearly living through a period of financial repression. The symptoms include:
- Artificially low interest rates in most of the G20 countries and commitments to keep them low for long periods of time combined with inflation, which results in negative real interest rates
- Large expansion of central banks’ balance sheets through the purchase of government bonds
- Basel III liquidity rules which force banks to hold more government debt on their balance sheets6,
- Newly nationalized banks in many countries (UK, Ireland, Spain, etc.), which have drastically increased their holdings of government debt
- and it will bet worse...
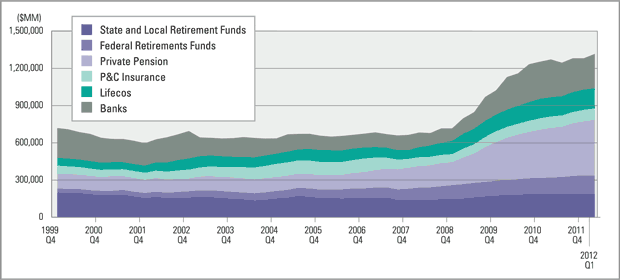
Figure 3 below shows that financial repression can be observed within the holdings of U.S. financial institutions and pension funds, which have steadily increased their holdings of U.S. Treasuries since 2009.
FIGURE 3: HOLDINGS OF U.S. TREASURY SECURITIES BY DOMESTIC FINANCIAL INSTITUTIONS

Source: Federal Reserve Flow of Funds
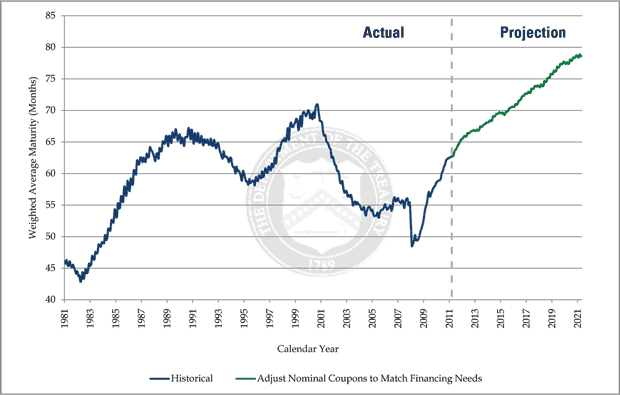
It’s clear that governments are preparing for more. A key component to erasing government debt through inflation is extending the duration (maturity) of one’s outstanding bonds. In a normal bond market, negative real interest rates make it difficult to roll over short-term debt at low borrowing rates (although financial repression and captive financial institutions certainly help to keep rates lower than they normally would be). Due to this tendency for short-term rates to rise with inflation, however, it is in the best interests of highly-indebted countries to issue the majority of their bonds at the long end of the yield curve. As Figure 4 shows, the US Treasury is proactively planning to increase the maturity of its outstanding debt (green line) in order to maximize its benefit from inflation erosion. In other words, they are capitalizing on the current flight to safety to set the stage for further financial repression down the road. The same is true for the U.K., which benefits from one of the longest weighted-average maturity of debt in the developed world. For Eurozone countries to do away with their current debt overhang they will either have to default (the least preferred option for political reasons) or use the good old combination of steady inflation and financial repression (feared by the Germans and the ECB central planners).
FIGURE 4: U.S. TREASURY WEIGHTED AVERAGE MATURITY OF MARKETABLE DEBT

Source: U.S. Treasury Office of Debt Management, Fiscal Year 2012 Q1 Report
Conclusion
On both sides of the Atlantic, the largest contributors to the current crisis are excessive debt and spending. We are now at a point where additional government stimulus measures will have negligible, if not detrimental effects on the economy and long-term growth. Debt has to be reduced, not increased by more deficits. Central planners have demonstrated that they don’t have the discipline to implement the Keynesian model of surplus in good times in order to finance deficits in bad times. We have now reached the limit of indebtedness and need to muddle through a painful but necessary deleveraging.
The politically favoured option of financial repression and negative real interest rates has important implications. Negative real interest rates are basically a thinly disguised tax on savers and a subsidy to profligate borrowers. By definition, taxes distort incentives and, as discussed earlier, discourage savings. Also, financial institutions, which are traditionally supposed to funnel savings towards productive investments, are restrained from doing so because a large share of their balance sheets is encumbered by government securities. The same is true for pension funds, which instead of holding corporate paper or shares, now hold an ever growing share of public debt. Pensioners, who are also savers, get hurt in the process.
The current misconception that our economic salvation lies with more stimulus is both treacherous and self-defeating. As long as we continue down this path, the “solution” will continue to be the problem. There is no miracle cure to our current woes and recent proposals by central planners risk worsening the economic outlook for decades to come.
Footnotes:
1 Bergh, A., Henrekson, M. (2011): “Government Size and Growth: A Survey and Interpretation of the Evidence”, Research Institute of Industrial Economics, IFN Working Paper No. 858, April 2011.
2 Bergh, A., Karlsson, M., (2010): “Government Size and Growth: Accounting for Economic Freedom and Globalization”, Public Choice 142 (1–2): 195–213.
3 Reinhart, C., Rogoff, K. (2010): “From Financial Crash to Debt Crisis”, National Bureau of Economic Research, NBER Working Paper #15795, March 2010. Reinhart, C., Rogoff, K. (2011): “A Decade of Debt”, National Bureau of Economic Research, NBER Working Paper #16827, February 2011. Reinhart, C., (2012): “A Series of Unfortunate Events: Common Sequencing Patterns in Financial Crises”, National Bureau of Economic Research ,NBER Working Paper #17941, March 2012.
4 Reinhart, C., Sbrancia, B. (2011): “The Liquidation of Government Debt”, Bank of International Settlements – Monetary and Economic Department, BIS Working Paper #363, November 2011. Reinhart, C., Reinhart, V., Rogoff, K. (2012): “Debt Overhangs: Past and Present”, National Bureau of Economic Research ,NBER Working Paper #18015, April 2012.
5 McKinnon, R., (1973): “Money and Capital in Economic Development”, Washington DC: Brookings Institute. Shaw, E., (1973): “Financial Deepening in Economic Development”, New York: Oxford University Press.
6 Bordeleau, E., Graham, C., (2010): “The Impact of Liquidity on Bank Profitability”, Bank of Canada Working Paper, WP#2010-38, December 2010.


