by Jeffrey Saut, Chief Investment Strategist, Raymond James
“Yogi Berra”
August 6, 2012
“It’s hard to make predictions, especially about the future.”... Yogi Berra
To be sure, “It’s hard to make predictions, especially about the future,” and last week was no exception. I began the week, as stated in Monday’s missive, noting that there would be a trifecta of potentially market moving news events. The first was the two-day FOMC meeting where I thought the Fed would change its policy statement with a lean toward more accommodation. My reasoning was that the Fed would appear too political by waiting until the September meeting, just a few short weeks before the election. WRONG; and that was pointed out to me in spades on Thursday because while Wednesday’s “no change” policy announcement only produced a stutter step for the S&P 500 (SPX/1390.99), by Thursday the SPX swooned. Indeed, by mid-session the SPX had shed more than 20 points from Wednesday’s closing price (1375), and in the process tagged its intraday low of 1354. By the close, however, the index had recouped about half of those intraday losses, ending the sloppy session at 1365. Actually, Thursday’s late in the day recovery was yet another surprise to me because hereto my early week prediction was there would be no surprise from the European Central Bank meeting. But, a surprise it was with Mario Draghi unwilling to make good on his previous week’s market moving statement that, “Within our mandate, the ECB is willing to do whatever it takes to preserve the euro and, believe me, it will be enough.”
WRONG; and I had to suffer through that night’s, and early Friday morning’s, parade of pundits talking about how bad the employment number might be. Such musings should have had a dilatory effect on the preopening futures, but that wasn’t the case as a number of other rumors swirled down the canyon of Wall Street with positive implications. Still, everyone awaited the numba’! And as stated in Thursday’s verbal strategy comments, I had no idea as to what the number was going to be given the wide dispersion of previous reports; yet, my sense was it was going to be close to consensus. WRONG again because Friday’s number was much better than expected with nonfarm payrolls rising to 163,000 versus the median forecast of +100,000. Lost in the euphoria, however, was that the unemployment rate rose from 8.216% to 8.253%.
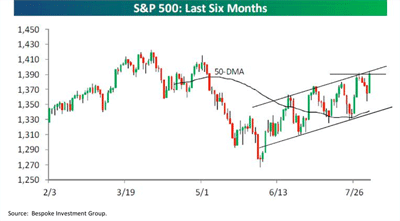
So it was three “strikes” and “out” for me and my predictions last week. About the only thing I got right was saying in Thursday morning’s verbal strategy comments that any pullback should be contained in the 1360 -1366 zone so often mentioned in these comments; and contained it was, with Thursday’s close of 1365. Given Friday’s surprise number, the SPX sprinted to its highest closing price since May 3rd and reinforced my more bullish stance of the past few weeks (as opposed to my previous trading range, but not bearish, stance). Friday’s Fling took the SPX up to the top of a parallel channel, as can be seen in the chart on page 3 from the astute Bespoke organization. If it can break out above that channel, last April’s reaction high of 1422 should be the next objective.
Regrettably, a strong earnings season has not been the driver of the upside breakout. Verily, of the 1,702 companies that have reported, the earnings beat ratio stands at 59.9%, well behind the S&P 500’s beat rate of 67.3% (376 companies have reported). Meanwhile, the revenue beat rate stands at only 48.2%. Yet by far the most troubling metric is the company’s forward earnings guidance, which is currently negative. Despite that forward guidance, the bottom up consensus earnings estimates for the SPX remain around $102 for this year and near $115 for 2013. If those estimates are anywhere near the mark, it means the SPX is trading at 13.6x this year’s estimates, and at 12x next year’s estimates, with concurrent earnings yields (earnings ÷ price) of 7.3% and 8.3%, respectively. Using the yield on the 10-year Treasury Note of 1.6% as your risk free rate of return produces what an analyst terms an equity risk premium of 6.7% basis next year’s estimates (earnings yield 8.5% - 1.6% risk free return = 6.9% equity risk premium, or ERP). Investopedia defines an ERP as:
“The excess return that an individual stock, or the overall stock market, provides over a risk-free rate [of return]. This excess return compensates investors for taking on the relatively higher risk of the equity market.”
QED, investors are being “compensated” by 6.7% (ERP) to own the SPX instead of the 10-year T’note.
While the aforementioned valuations are not as parsimonious as they were at last year’s October 4th undercut low (we were very bullish), they are still pretty inexpensive, offering the long-term investor a decent risk/reward ratio when combined with the SPX’s 1.9% dividend yield. Yet, I understand investors’ reluctance to commit capital since it seems like the trading of the “headline” < i>du jour is creating too much volatility. Interestingly, one vehicle that attempts to damp down some of that volatility is the PowerShares S&P 500 Low Volatility ETF (SPLV/$28.05), which consists of the 100 stocks in the S&P 500 with the lowest realized volatility over the trailing 12 months. This ETF currently yields 2.9%; as always, details should be checked before purchase.
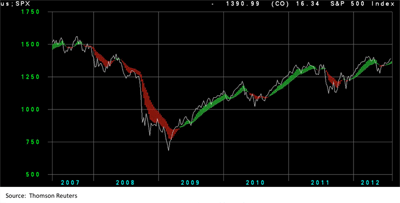
Another strategy that has been working for the past few quarters has been to consider companies that have beaten quarterly earnings estimates, as well as revenue estimates, and guided forward estimates higher. Some names from the Raymond James research universe that have recently met these three criteria, are favorably rated by our fundamental analysts, and have “greened up” on indicators, like the SPX chart on page 3 shows, include: BioMed Realty Trust (BMR/$18.76/Outperform); Extra Space Storage (EXR/$33.45/Outperform); Kimco Realty (KIM/$19.94/Outperform); Power-One (PWER/$5.13/Outperform); Post Properties (PPS/$51.23/Strong Buy); and Wabtec (WAB/$78.38/Outperform).
The call for this week: As a sidebar, be sure to look at this month’s edition of < i>Gleanings for further insights from our economist, technical analyst, and my additional thoughts. As far as the stock market, last Friday’s rally extended the upside breakout by the SPX above the often mentioned 1360 – 1366 zone; and at this point, that breakout looks sustainable. The rally has also broken the index above the “neckline” of what a technical analyst would term a reverse head and shoulders bottoming pattern (read: bullishly). That said, the rally has left the SPX at the top of the parallel channel previously mentioned, as well as leaving every macro sector I follow pretty overbought in the short term. Also of note is that while the D-J industrials, the S&P 500, and the D-J Utilities bettered their June reaction highs, the S&P 400 MidCap, the S&P 600 SmallCap, the NASDAQ Composite, the Russell 2000, and the Value Line Arithmetic Index did not (read: potential non-confirmation). Still, the stock market’s internal energy continues to look strong, my proprietary indicators have been “green” on the S&P 500 for six weeks (see chart on page 3), the Dollar Index got crushed on Friday (lower dollar means the “risk trade” is back on), short interest on the NYSE is high, the equity markets survived a potential “flash crash” from the Knight Capital (KCG/$4.05/Market Perform) fallout, the recent investor sentiment figures were about as negative as they ever get, the public liquidated another $2.7 billion of domestic equity mutual funds last week (the highest weekly redemption of the year), the Spanish market rallied 7.41% on Friday, well y’all get the idea. Recently participants have been conditioned to sell each marginal breakout to a new reaction high because it has been followed by a pullback. I am not so sure this breakout plays that way. Indeed, I expect at least a test of the April highs (1422) over the next few weeks before a corrective phase begins.
P.S. – I will be in Boston all week spending time with portfolio managers, seeing accounts, and speaking at a conference. I will try and do my verbal strategy comments, but they are likely going to be abbreviated.

Click here to enlarge

Click here to enlarge


