The comments below were provided by Kevin Lane of Fusion IQ.
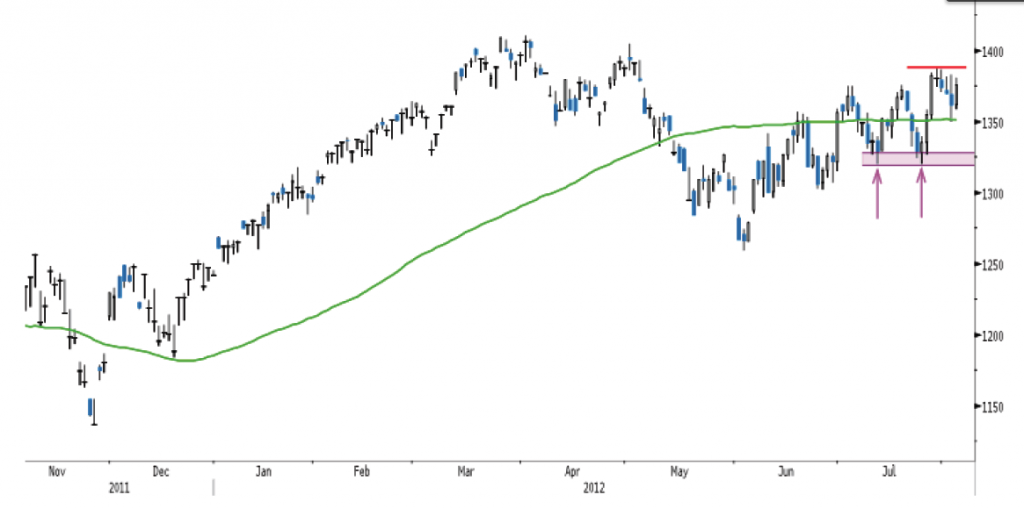
As seen in the chart below the S&P 500 Index (SPXĀ 1390.99 āā1.90%) held its 100-day moving average yesterday (green line) near 1,350 and today is bouncing on ECB news and better-than-expected-non-farm payrolls ā does anyone smell election year mark-ups? That said, the Index is still setting higher lows since its June low, which is bullish; however it has also been capped near the 1,385 area (red line) for a while now. The Index continues to remain locked in a range, with resistance at 1,385, and near-term support at 1,350. [PduP: The closing level on Friday was 1,391.] Whichever way it breaks, momentum will surely follow. More meaningful support lies near the 1,330 ā 1,325 band (purple-shaded lines and arrows) as this was the area where the S&P 500 double-bottomed recently. This is the area that is most critical in regard to keeping the market together.
There are conflicting data that could support a breakout (i.e. more consistent levels of news highs, low long exposure levels and low levels of bullish sentiment) or a breakdown (i.e. weak action in cyclicals and transports, especially truckers). However, if forced to choose, we are leaning towards an upside breakout. That said, we wonāt be ashamed to pull the rip cord if key supports are broken as this would take the breakout call off the table. After all, being wrong once in a while is inevitable, however, ignoring an oncoming truck (i.e. a break of support) assuming you can swerve around it, is never a smart strategy!
This game is about knowing when to press forward, when to sit tight and watch, when to retreat and, most important, knowing when to change strategies if need be!
Source: Source: Kevin Lane, Fusion IQ, August 3, 2012.


