by Guy Lerner, The Technical Take
There certainly is a lot of belief in the Bernanke put. And that belief exists whether you are bullish or bearish on the markets. If you are bullish, you acknowledge the “put” and buy knowing Ben has your back. If you are bearish, you acknowledge the “put” and sit on the sidelines knowing that the music is likely to stop at anytime. The Bernanke “put” is no longer rumor. Everyone believes in it and it would seem likely baked into the market. This belief existed 8 weeks ago when the market sold off and the belief in the mantra “Ben has your back” is even stronger today as the market has worked its way back towards the recent cyclical highs. From this perspective, this sets up a “buy the rumor, sell the news” scenario when the Fed announces its next bold plan to “save” the economy this week.
But the belief in the “put” won’t die easily as investors seem to be fixated on the fact that central bankers can fix the economy. We know they can try and likely will because that is their job, but each intervention seems to produce less and less an effect on the markets and on the economy. It isn’t like these stewards of the economy have discovered the financial fountain of youth. Furthermore, there is always a new data point of hope just on the horizon that will always prompt investors to believe that the next big liquidity operation is just around the corner.
As discussed previously, the investor sentiment picture remains consistent with a market top.
The “Dumb Money” indicator (see figure 1) looks for extremes in the data from 4 different groups of investors who historically have been wrong on the market: 1) Investors Intelligence; 2) MarketVane; 3) American Association of Individual Investors; and 4) the put call ratio. This indicator is neutral.
Figure 1. “Dumb Money”/ weekly

Figure 2 is a weekly chart of the SP500 with the InsiderScore “entire market” value in the lower panel. From the InsiderScore weekly report: “Market-wide insider sentiment continued to be Neutral last week as insider trading activity remained near a seasonal low-point. The number of unique non-10b5-1 plan buyers and sellers was the third-lowest in our 446-week (dating back to January 1, 2004) tracking period, bested only by the prior week and the third week of April this year. Activity will begin to pick-up late this week/early next week and transactional volume will increase significantly as insiders at the first-round of earnings reporters are free to buy/sell again.”
Figure 2. InsiderScore “Entire Market” value/ weekly

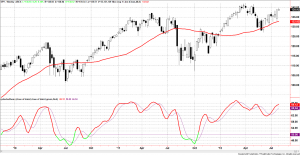
Figure 3 is a weekly chart of the SP500. The indicator in the lower panel measures all the assets in the Rydex bullish oriented equity funds divided by the sum of assets in the bullish oriented equity funds plus the assets in the bearish oriented equity funds. When the indicator is green, the value is low and there is fear in the market; this is where market bottoms are forged. When the indicator is red, there is complacency in the market. There are too many bulls and this is when market advances stall. Currently, the value of the indicator is 69.12%. Values less than 50% are associated with market bottoms. Values greater than 58% are associated with market tops. It should be noted that the market topped out in 2011 with this indicator between 70% and 71%.
Figure 3. Rydex Total Bull v. Total Bear/ weekly


