by Dodd Kittsley, CFA, iShares
One of the advantages to working for the largest exchange traded product (ETP) provider in the world is that you have a lot of data at your disposal. In my role as the Global Head of ETP Research for BlackRock, I deal in data every day, particularly as it relates to the in- and outflows of the 4500+ global ETPs currently in existence. As you can imagine, examining flows can be a great way to spot investment trends, take the temperature of the market and reveal sentiment shifts.
Right now, for example, global ETPs just experienced their largest first half inflows ever. ETPs attracted net new assets of $105 billion during the first half of 2012, representing a 16% increase on the $90.6 billion of flows posted during H1 2011. Total industry assets now stand at nearly $1.7 trillion.
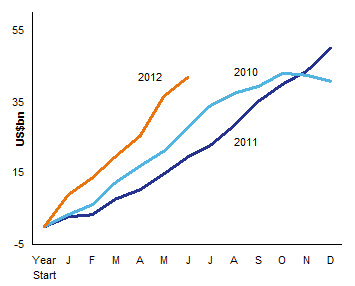
Not surprisingly, fixed income ETPs were a main driver of growth. As global markets continue to be volatile, investors have increasingly been using these products to capture new and diversified sources of income. Fixed income ETPs attracted 41% of all inflows with $42.0 billion on the year, or 114% above 2011’s comparable YTD figure of $19.6bn. In fact, June was the 18th consecutive month in which global fixed income ETPs have attracted net inflows. Total assets invested in fixed income ETPs now exceed $300 billion and account for over 18% of total industry assets.
But here’s something you might not have guessed – within fixed income, investment grade corporate ETPs were the clear leader, bringing in $15.5 billion. Throughout this year, investors have consistently committed new money to the category, with monthly flows ranging from $1.7bn to $3.2bn. It appears that many investors may agree with Russ K’s feeling that investment grade debt is the place to look for relative safety (albeit less than Treasuries) with the opportunity for positive real yield.
So what do we think is in store for the second half of the year? Well, if volatility remains an issue (and Russ K believes it will), we expect to see the flows into fixed income ETPs continue (see chart below). In fact, if they continue to follow their current trajectory, FI ETPs could actually sextuple their assets over the next 10 years – from $300 billion to $2 trillion. As my colleague and fellow blogger Matt Tucker has said many times, investors are starting to realize that fixed income ETPs are simply a better way to invest in bonds.
Fixed Income Cumulative Net New Asset Trends
Never one to keep a good story to myself, I’ll be sharing interesting ETP flow data and related insights on a regular basis here on the iShares blog. And I’d love to hear from all of you – what questions do you have that our data might be able to answer?
Source: BlackRock Investment Institute


