July 16, 2012
by Liz Ann Sonders, Senior Vice President, Chief Investment Strategist, Charles Schwab & Co., Inc.
Key Points
- A square root-shaped economic recovery unfolding as expected, but growth scare is back again.
- Consumer and business confidence has been getting hit … but the stock market's been resilient.
- Investors are despairing and have "de-risked," but defensive positioning should continue.
Regular readers may recall back in the spring of 2009 when we opined that the recession was likely ending that we felt the shape of the recovery would look a bit like a square root sign—a v-shaped recovery initially, followed by a flatter/slow-growth phase. We're certainly past the v-shaped bottom and have now been "muddling" the past two years.
The series of charts below serves to illustrate a few key messages about the present environment. The first looks at nominal US gross domestic product (GDP). It's pretty square root-shaped, no? The second shows the Citigroup Economic Surprise Index (CESI), which measures whether economic reports are surprising on the upside or downside relative to consensus expectations.
Given the sharp drop and subsequent sharp recovery in nominal GDP between 2007 and 2010, it's no surprise to see volatility in the CESI during that period. More interesting is the relative stability in nominal GDP the past two years yet continued considerable volatility in the CESI during the same period. If there's any potential silver lining to these extremes in economic surprise swings, it's that the stock market tends to rally not long after economic surprises hit their troughs of weakness, as you can see in the third chart.
GDP Less Volatile Than Indicators or Market
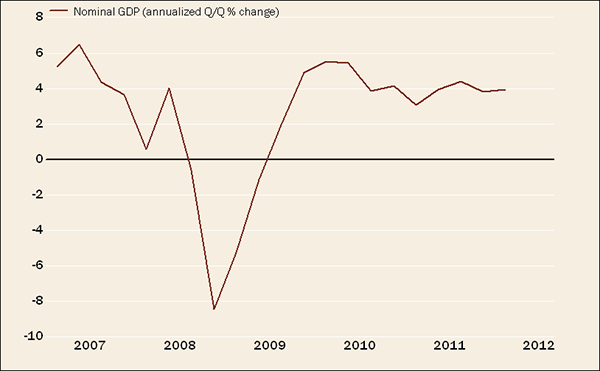
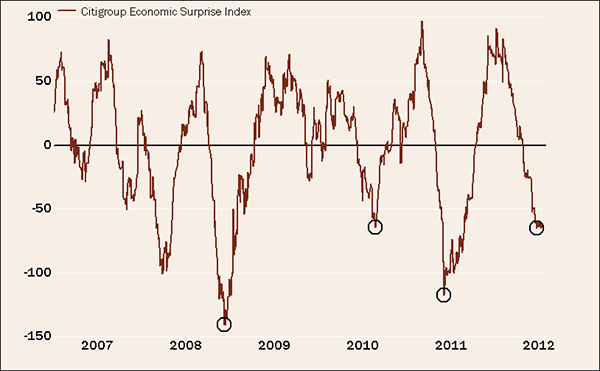
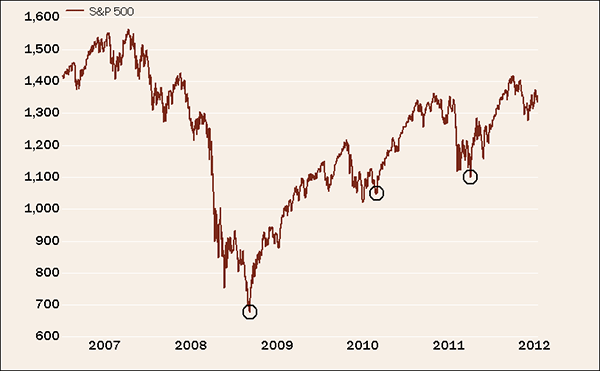
Source: BCA Research, Inc., FactSet. GDP as of March 31, 2012; Citigroup Economic Surprise Index and S&P 500 as of July 13, 2012.
Déjà vu
In the CESI chart above you can clearly see that we're in the midst of the third consecutive mid-year growth scare since the recession ended in mid-2009. Using ISI's economic diffusion index, which tracks dozens of high-frequency economic indicators and measures strength minus weakness, you can see the eerie similarity in another form.
Economy Following 2010/2011 Path?
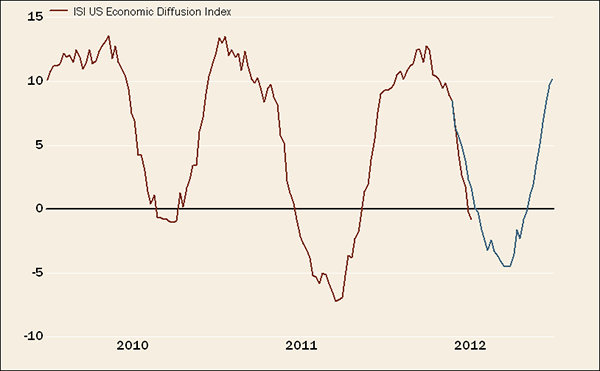
Source: FactSet, ISI Group, as of July 9, 2012. Blue line represents estimated growth path.
The estimated path shown (blue line) on the chart represents an average of the two prior growth scares and could be a road map to what's ahead in the near term. If so, there's a bit more weakness to come, but we're getting close to a potential turn. There are reasons both for hope and some despair.
Hope comes from the meaningful recovery underway in housing, the significant drop in energy prices and massive global central bank easings (thanks to falling commodity inflation). Despair emanates from the looming "fiscal cliff," China's hardening soft landing, the ongoing eurozone debt/economic crisis, weakening corporate earnings and increasing political polarization (not just in the United States).
Confidence crush
The headwinds noted above have manifested themselves in stunted business and consumer confidence as well as restrained hiring. Underlying the latest weak jobs report was an uptick in both hours worked and hourly wages, which suggests that business fundamentals may not have deteriorated as markedly as confidence. That view is supported by the latest reading of Strategas' Leading Indicator of Manufacturing (SLIM), which provides an early indication of change in US manufacturing activity.
Recall the very weak ISM Manufacturing Index last month—particularly the new orders component—which furthered fears of recession. It was telegraphed the month prior by weakness in SLIM. The early indication for July shows new orders improving significantly following June's disconcerting decline.
Again, what we may be seeing is a sharp hit to confidence over the past couple of months that had more to do with concerns about the eurozone crisis and less with underlying business fundamentals. I want to show you a unique perspective about confidence as it relates to the stock market.
I've written countless reports on investor sentiment, which works in a contrarian fashion. Interestingly, so does business and consumer confidence. The two charts below show CEO and consumer confidence and the relationship their extremes have to stock-market performance. What you see in both cases is that extremes of pessimism on the part of both constituents have generally been accompanied by the highest stock market returns.
Weak CEO/Consumer Confidence = Better Market
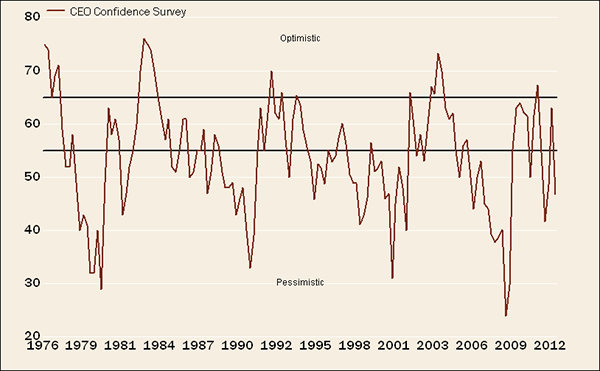

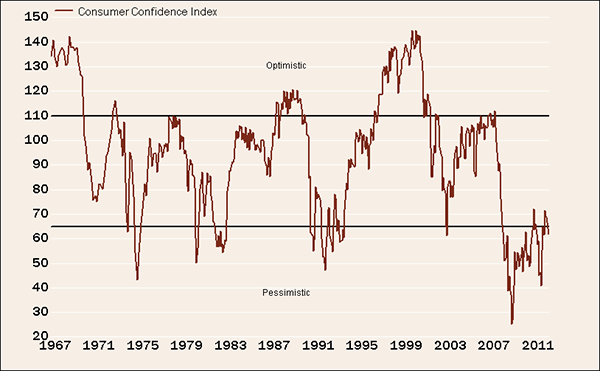

Source: Conference Board, FactSet, Ned Davis Research (NDR), Inc. (Further distribution prohibited without prior permission. Copyright 2012 (c) Ned Davis Research, Inc. All rights reserved). CEO Confidence as of June 30, 1976-June 30, 2012. Consumer Confidence as of February 28, 1969-June 30, 2012.
CSI shows lower stressa
Many years ago I created a "Consumer Stress Index" which combines the effects of the stock market, job growth, incomes, home prices, oil prices, medical care inflation, food inflation and household liabilities into a single index. As you can see in the chart below, stress is actually relatively low compared not only to its recent recession-era high, but also relative to a longer-term history.
Lower Consumer Stress
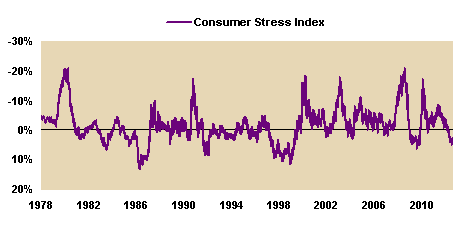
Source: FactSet, as of July 13, 2012. Data plotted on inverted scale.
Resilient stock market
The pervasive negativity is neither surprising nor without easy explanations. What's amazing to some (present company excluded) is the way the stock market has held up. Bears believe the market is wrong. I don't think the market is ever "wrong." Bulls believe the market is right, has priced in many of the negatives, and is illustrating that investors have become too emotional. Although I think the market will continue to navigate rough waters in the short term, I side with the bulls longer-term.
Part of the market's resilience is also a function of investors—both individual and institutional—having already "de-risked." Investor sentiment is certainly pessimistic, as I've written about in two recent reports. Hedge funds' invested exposure is down near where it was at the 2009 market low and US stock mutual funds have very high interest-rate-adjusted cash positions, as you can see in the chart below. This is likely serving to cushion the impact of the aforementioned macro headwinds.
High Mutual Fund Cash/Assets Relative to Rates
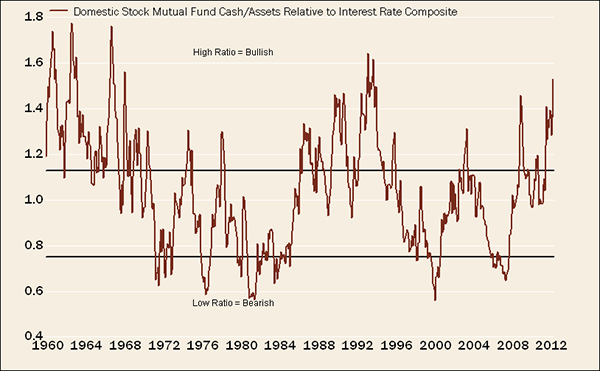

Source: FactSet, Ned Davis Research (NDR), Inc. (Further distribution prohibited without prior permission. Copyright 2012 (c) Ned Davis Research, Inc. All rights reserved), as of January 1, 1960-May 31, 2012. Interest-rate composite=average yield (90-day Treasury bill yield + 10-year Treasury note yield + BAA bond yields)/3.
Earnings slowing
A more micro-level headwind is with us in the form of second-quarter earnings season. Median S&P 500 earnings expectations have dropped sharply over the past couple of months and now stand at less than 4% year-over-year growth for the second quarter—a relatively low bar compared to the 8.3% growth reported in the first quarter. I believe companies that underperform those lower expectations will be punished, but that for many companies the bar has been set sufficiently low. It does appear that 2013's estimates have not yet been lowered sufficiently, so that headwind remains ahead of us.
So what might an investor do?
As we tread the rough waters, investors should consider keeping some defense within portfolios, while not eliminating more cyclical exposure. Consistent with that view is our long-standing outperform rating on the information technology sector and our recent upgrade of the healthcare sector to an outperform rating. We also think a continued bias toward companies with lower foreign exposure may be warranted.
I recently looked at the relative performance of S&P 500 companies with high versus low foreign sales. Using a break point of 40% foreign sales, companies with a lower percentage are up more than 9% year-to-date, while the over-40% cohort is up 5.7%. Doing a more extreme comparison, as Bespoke Investment Group (BIG) recently did, companies with no sales outside the United States have outperformed those with more than 50% foreign sales by more than 12 percentage points (with the former up and the latter down sharply). In the near term, we expect that to continue.
The bottom line is that stock-market action has been diverging from macro headlines, and generally it pays to side with the market, which is a discounting mechanism—headlines simply recount what's already happened. The market's technical conditions are sound, sentiment is pessimistic (a good thing), and it's a presidential election year. As Ned Davis Research has pointed out, history shows the second half of election years have brought healthy market odds. Of 21 cases since the S&P 500's inception in 1928, the market has been up in the second half of election years 17 times (an 81% hit rate). The median gain has been 6%, with a median maximum rally of 12% and a median maximum decline of 7%.
Important Disclosures
Past performance is no guarantee of future results.
The information provided here is for general informational purposes only and should not be considered an individualized recommendation or personalized investment advice. The investment strategies mentioned here may not be suitable for everyone. Each investor needs to review an investment strategy for his or her own particular situation before making any investment decision.
All expressions of opinion are subject to change without notice in reaction to shifting market conditions. Data contained herein from third-party providers is obtained from what are considered reliable sources. However, its accuracy, completeness or reliability cannot be guaranteed.
Examples provided are for illustrative purposes only and not intended to be reflective of results you can expect to achieve.


