Could “Confidence” Add 50 Percent to the Stock Market?
by James Paulsen, Chief Investment Strategist, Wells Capital Management
Fear (a lack of confidence) has dominated the economic and investment climate since the 2008 crisis. Indeed, excessive fears during the crisis likely accentuated the magnitude of the economic collapse far more than did poor economic fundamentals alone. Similarly, the inability to revitalize confidence since has also hampered both the economic and stock market recoveries.
A culture devoid of confidence has proved a chronic liability during the last five years. However, could a slow but steady revival in confidence soon become a primary asset driving stock prices higher? For a third time in the post-war era, since 2008, the U.S. stock market has traded below its long-term trendline level (that is, the level of the stock market if it rose through time at a constant pace equal to its long-term average return). While the slope of the stock market’s trendline tends to approximate the sustainable earnings growth rate, the degree to which the stock market trades above or below its trendline level has depended primarily on economic confidence. As shown below, should confidence simply rebound to a normal recovery level in the next several years, the return of the U.S. stock market may be boosted by 50 percent!
Post-War U.S. Stock Market vs. Trendline
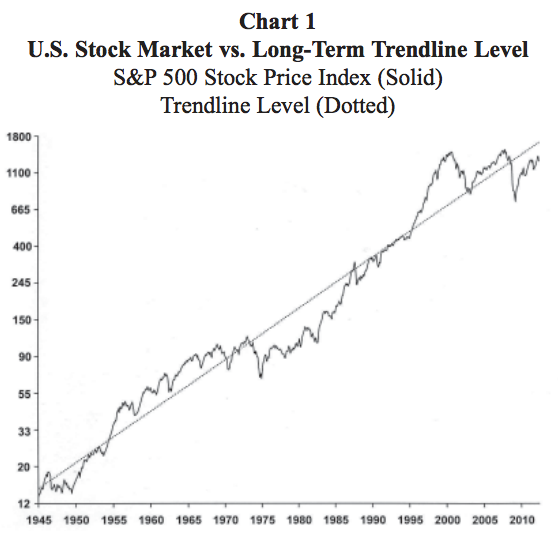
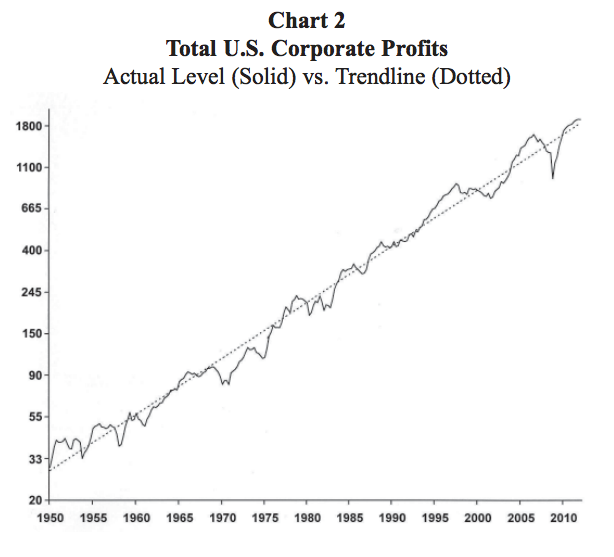
Charts 1 and 2 compare both the U.S. stock market and U.S. corporate earnings relative to their respective post-war trendline levels. In each case, the trendlines are calculated by a simple regression of the (natural log) level of the stock market or profits against time. The slope of each trendline is a proxy for the average annualized growth rate over the entire period. Not surprisingly, since stock prices respond to earnings, the trendline slope of corporate profits and of the U.S. stock market are nearly identical at about 7 percent. And, 7 percent is very close to the annualized growth in nominal GDP—since 1949, nominal GDP growth has averaged about 6.7 percent overall. Essentially, over long periods of time, earnings cannot grow faster than overall economic growth and the buy and hold price only return from the stock market approximates the long-term pace of earnings growth.
Is Historic Earnings Trendline a Good Guide to Future?
In the post-war era, the annualized total return from stocks has been about 11 percent comprised by about 7 percent earnings growth and about 4 percent dividend returns. As shown in Chart 1, however, in the last decade, the stock market has significantly trailed relative to its trendline. Is the old trendline growth rate of about 7 percent still a reasonable expectation for the future?
Certainly, U.S. balance sheets are more leveraged today and the savings rate has been far lower in recent years compared to earlier in the post-war era. Moreover, aging U.S. demographics almost ensures slower labor force growth in future years (a moderating force for overall economic growth) unless immigration policy is considerably liberalized. Alternatively, in the last couple decades, the global economy has created a fabulous new economic growth booster—functioning emerging world economies! So far, these new economic entities have mainly augmented supply capabilities but several are on the cusp of becoming burgeoning middle class economies which should dramatically boost global demand and perhaps help maintain global economic growth rates even as developed economies age.
Most encouragingly, however, as shown in Chart 2, U.S. earnings continue to follow the long-term trendline established throughout the post-war era. Despite noticeably slower average GDP growth in the U.S. since 1985, earnings growth has continued to approximate its historic long-term trendline. Indeed, despite the pronounced and ongoing concerns surrounding the contemporary recovery, U.S. earnings bounced quickly above trendline after the recession and have since risen in line with trendline growth. Overall, earnings show no signs yet of breaking below long-term results suggesting the long-term trendline for the stock market may remain near post-war norms.
The Valuation of the Earnings Trend
Although stocks are ultimately tethered to earnings, in the short-run, the stock market often trades at a premium or discount to its trendline. As illustrated in Chart 1, the difference between the stock market and its long-term trendline is a good proxy for investors’ valuation of the long-term earnings trend. Since 2008, for the third time in post-war history, the U.S. stock market has traded persistently “below” its trendline. This also occurred after WWII until the mid 1950s, and again between the early 1970s until the late 1980s.
This is also illustrated in Chart 3. What causes investors to value the earnings trend sometimes at a 25 percent (or more) premium and sometimes at a 25 percent (or larger) discount? Certainly, multiple factors comprise this complicated valuation. During the late 1940s, the discount to trendline seemed to be driven by a post-war inflation surge, in the 1970s escalating inflation and interest rates appeared to lower valuations, and in the contemporary period persistent anxieties surrounding the potential for a global financial calamity have dominated. By contrast, the huge premium paid by investors for trendline earnings in the 1960s coincided with attitudes reflected in the “Camelot Kennedy Years” while the record-setting premium valuation reached in the late 1990s was a product of a “new-era” mania.
Confidence & Valuations
As shown in Chart 4, the discount or premium valuation of the stock market relative to its trendline is perhaps best explained by economic “confidence.” This chart overlays the percentage differential of the stock market relative to its trendline with the consumer confidence index. Although not a perfect relationship, the level of confidence has done a good job tracing changes in the “valuation of the earnings trend” during the post-war era.
Since at least 1950, premium and discount valuations of the stock market to its trendline have corresponded closely with periods of strong economic confidence and periods of broad economic fear. Currently, U.S. economic confidence is hovering in the lowest quartile of its post-war range and the U.S. stock market is about 25 percent below its trendline. This is not a coincidence. As was the case in the late 1940s, early 1950s, and again in the 1970s, early 1980s, a slow but steady revival in U.S. confidence could represent the biggest driver of stock market performance in the next several years!

An Investment Possibility?
The confidence index illustrated in Chart 4 has oscillated between about 60 and 110. With the exception of the late 1990s when the index briefly reached above 110, “normal” economic recovery confidence peaks have been around 100. Stock investors should consider what could happen should confidence slowly recover to normal again in the next five years eventually reaching a level between 95 and 100. Using history as a guide (reading across to the left scale in Chart 4), if confidence returns to normal, the stock market would likely trade at a 25 percent to 30 percent premium to its trendline level.
Of course, in five years, the stock market trendline level will also be higher. If the historic trendline growth rate remains a good guide for the future, the trendline (the dotted line) in Chart 1 would rise by about 7 percent a year in the next five years suggesting a trendline by 2017 of about 2425. However, to be conservative, assume in the next five years trendline earnings only grow at a pace of 3 percent, significantly “less” than the long-term trendline growth rate of 7 percent. Currently, the S&P 500 trades at about 1350 and its trendline level (from Chart 1) is about 1800 (i.e., 25 percent higher than the S&P 500 current price of 1350). With these assumptions, the stock market trendline would rise by 16 percent in five years to about 2100!
Finally, from Chart 4, assume confidence improves from its current level to about 95 boosting the investor valuation of the trendline from its current 25 percent discount to about a 25 percent premium in five years. A trendline target in five years of about 2100, combined with a valuation premium of about 25 percent implies a target price for the S&P 500 of about 2600—nearly a double from today’s level!
Summary
While we are not forecasting a doubling of the stock market during the next five years, this analysis does highlight the longer-term upside potential from stocks which exist today solely because of widespread cultural fears. Chart 3 shows the stock market has a historical tendency to oscillate between periods of glee and gloom.
The eventual impact of the Great Depression and WWII on investor attitudes kept the stock market selling at a discount until the late 1950s. By contrast, the cultural euphoria which swept the country during the baby-boom years kept stocks oscillating about a 25 percent premium between the late 1950s and the early 1970s. The stock market could be bought at a 60 to 70 percent discount in the 1970s when runaway inflation and interest rates destroyed confidence. Twenty years later in the late 1990s, investors could not buy stocks fast enough in the “new-era” even though they paid a 60 to 70 percent premium! Since 1945, two bouts of cultural glee (1960s and 1990s) subjected investors to significant risks while recurring bouts of cultural gloom have treated investors with three remarkable “fire sales”—1940s, 1970s, and “today”! Stock prices will continue to oscillate and scary sell-offs will occasionally feed fears, but don’t miss this sale!


