by Tiho Brkan, The Short Side of Long
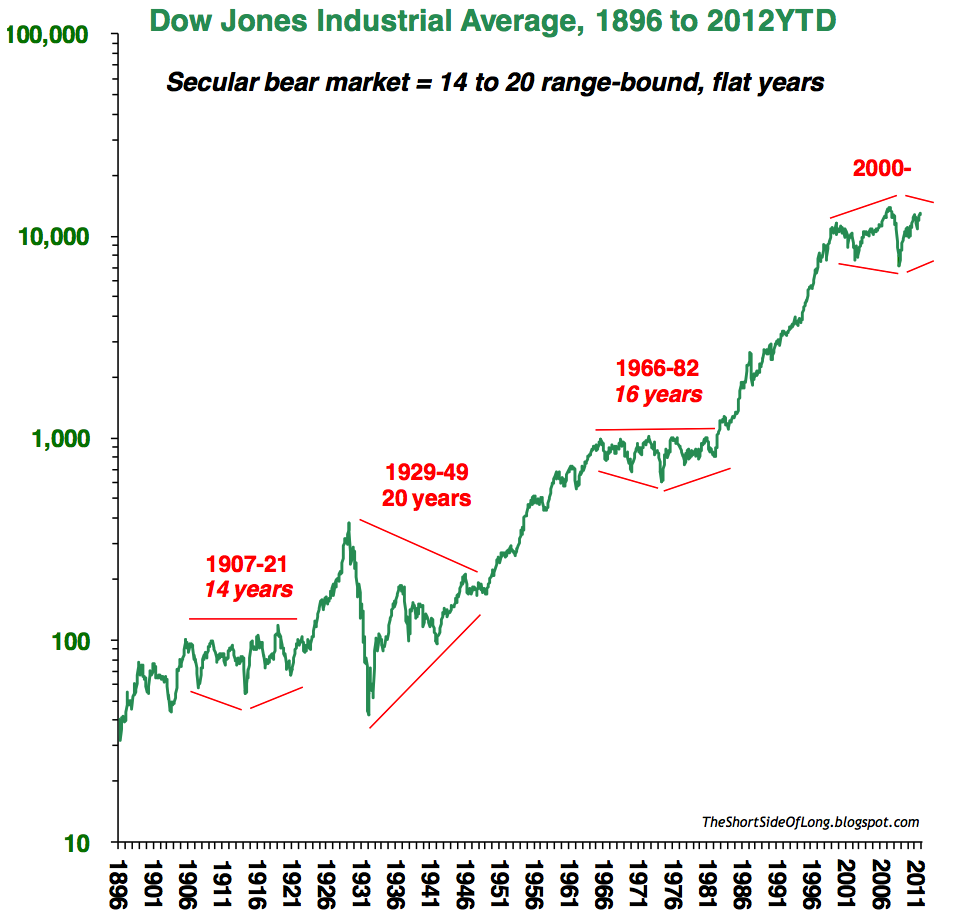
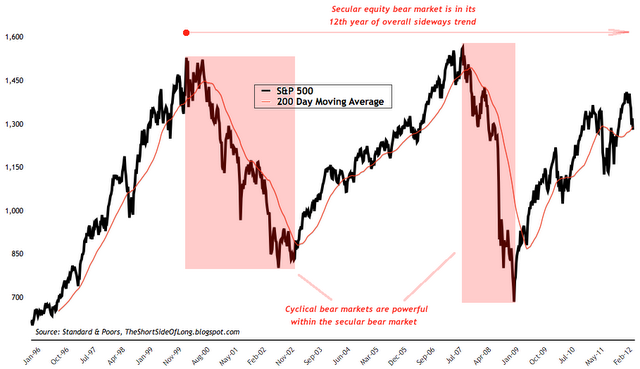
Equities tend to move in long term generational cycles of about 17 years on averages. Strong upward trends that last about 17 years are called secular bull markets, while sideways trends that also last about 17 years are called secular bear markets. US equities are currently in a secular bear market and have been so since the year 2000.
We seem to be creating a similar outcome to the 1970s secular bear market, where we had a long sideways trading range for about a decade and half. S&P 500 is now approaching the upper range of its trading range, with the current cyclical bull market doubling from its March 2009 lows. Bull markets usually climb a wall of worry, but there is not too many things left to worry about.
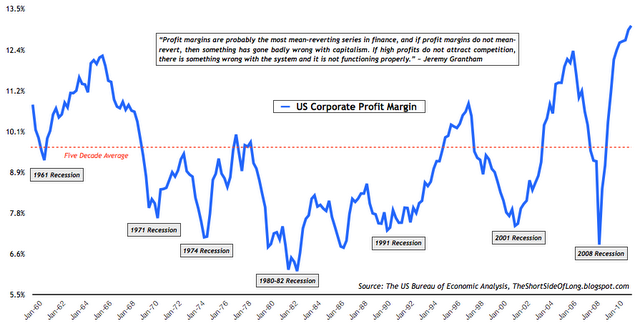
Gross profit margins are now at record highs and a mean reversion will eventually follow. Mean reversion in gross profit margins will be fundamentally bad for S&P 500 company earnings, which are also at record highs, and therefore the overall stock market value. Let us remember that all the major buying opportunities since World War 2 have been as low gross profit margins, not at highs - especially record highs.
Bonds
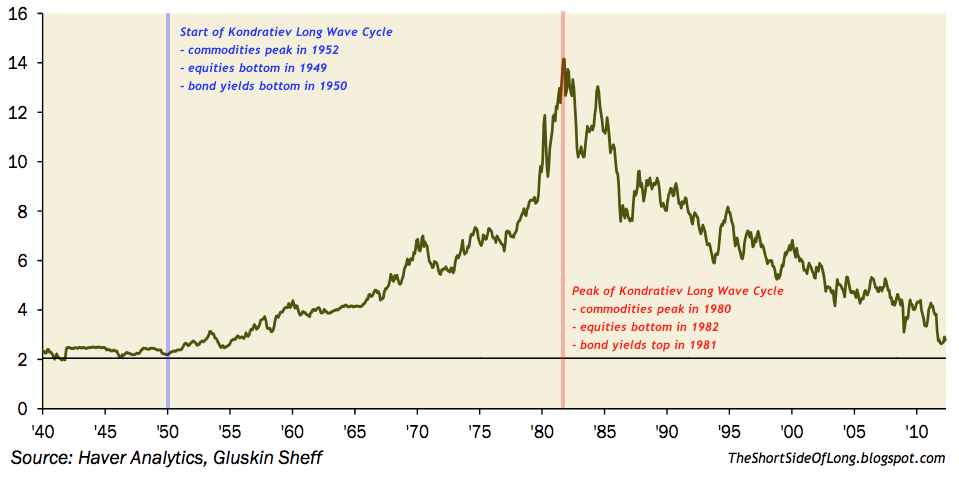
Interest rates, and therefore bond prices, tend to move in very long term generational cycles known as the Kondratiev Long Waves. These waves tend to last about 50 to 60 years from trough to trough or from peak to peak. The last major inflection point occurred in 1981, as interest rates on the US Treasury 30 Year Long Bond peaked around 15%. Prior to that, rates were rising for about 30 years and since than we have experienced declining rates for about 30 years as well. At the next major inflection point, which is slowly approaching, interest rates and equities should bottom while commodity prices should peak.
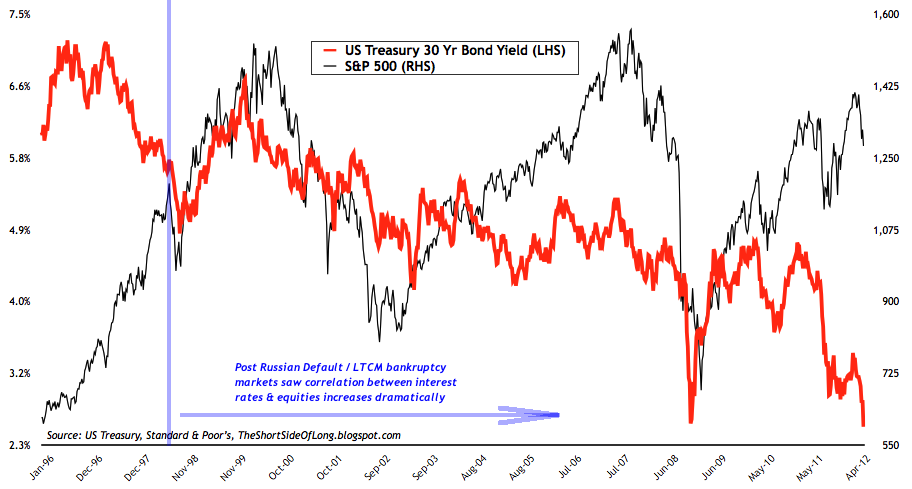
Viewing the global macro situation from the closer point of view puts forward a strong correlation betweens stocks and bonds due to the de-leverging cycle Western world is currently facing. Periods or phases of turmoil have so far been associated with "flight to safety" or "risk off" trade, where investors buy bonds (lower interest rates) and sell stocks (or other riskier higher beta assets).
With the risk assets prone to further crisis events out of Europe and potential up-and-coming global recession, bond interest rates have most likely not properly bottomed just yet. Nevertheless, we are definitely in the last euphoric stage of a 30 year bond bull market (from 1981 until present). The final trough in rates will also be associated with a stock market bottom, just like in late 40s and early 50s.
Commodities
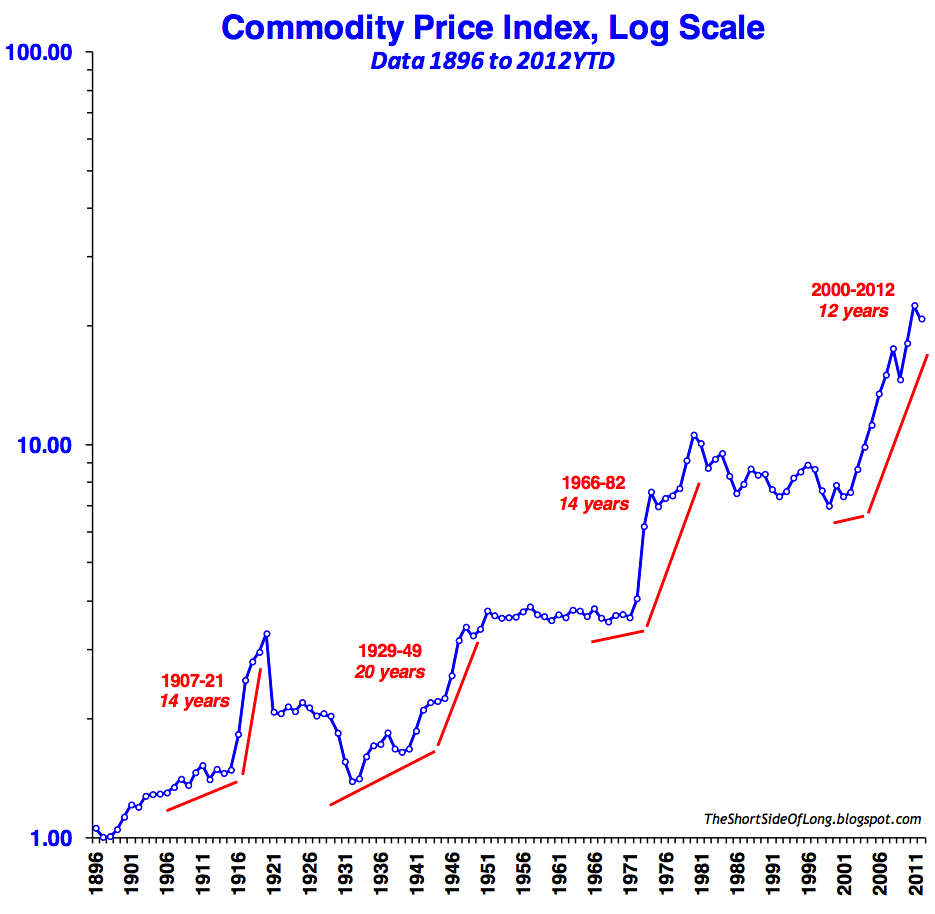
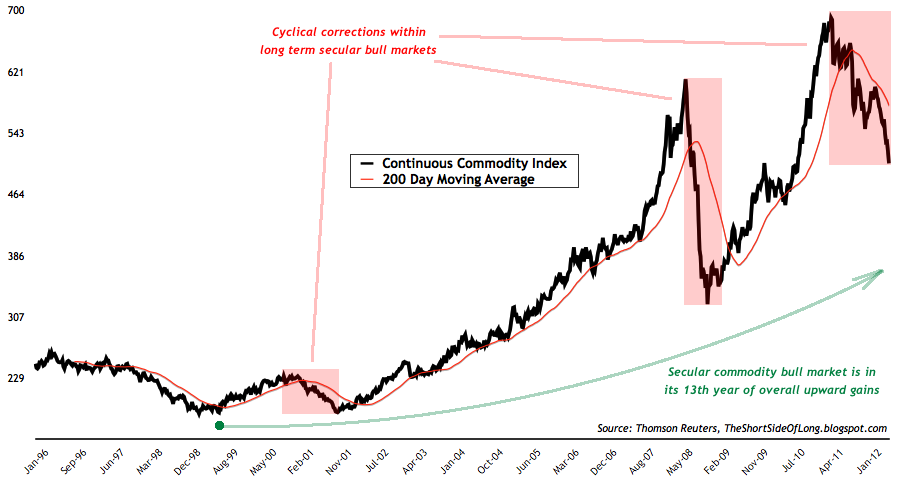
Commodities also tend to move in long term generational cycles and correlate in the opposite direction to the stock market. Here the same type of time frame also applies, where strong upward trends that last about 17 years are called secular bull markets, while sideways trends that also last about 17 years are called secular bear markets. Commodities are currently in a secular bull market and have been so since the year 1999.
While the S&P 500 has been moving sideways for about 12 years, Continuous Commodity Index has been rising over the last 13 years. During the current secular bull market, commodities have experienced two major corrective periods, first during 2001 recession and second during 2008 recession. Currently, commodities are once again experiencing a cyclical bear market correction, within the overall long term secular bull market.
Summary
Risk assets like equities and commodities should remain under pressure in coming quarters, while safe havens, even though extremely over stretches, could still benefit during the turmoil. World faces many problems coming into 2013, from US to European debt issues and now a meaningful economic slowdown in Asia, after years of powerful growth. China, the worlds largest consumer of many commodities and a fertile ground for many Western company expansions (especially luxury ones), could have huge implications on risk asset prices shall it suffer a major recession. Majority of the problems will definitely come to forefront as soon as the US elections finishes by the years end, if not sooner.
While many investors think they are doing the right thing being contrarians at present and buying risk assets due to sour negative sentiment, my view is that it will only be useful for a decently strong tradable rally, which I also plan to participate in. Furthermore, these same investors also believe central bankers will backstop any problems with money printing. However, that will most likely not be the case until the QE dosage increases substantially.
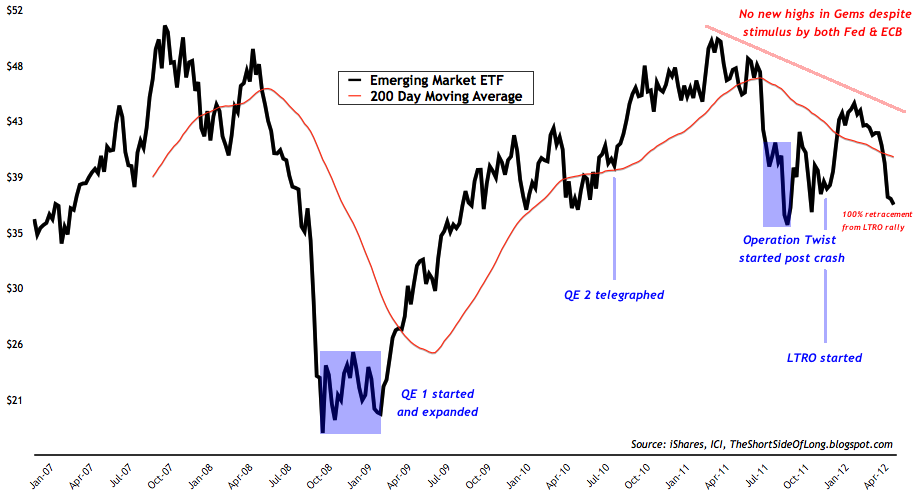
At present every major risk asset from Crude Oil to Australian Dollar, from DAX to Copper and from GEM equities to Gold has retraced 100% of their Twist / LTRO multi-month rally and has also failed to better their 2011 highs during the process. This is an extremely negative price action as these types of 100% re-tracements are not common at all, if one was to assume we are in strong cyclical bull market. Most likely the inflation trade from March 2009 lows has ended for some risk assets in May 2011, while for others it has ended just recently in May 2012.
Copyright © The Short Side of Long


