by Guy Lerner, The Technical Take
Equity investor sentiment remains mixed. The Rydex market timers (i.e., dumb money) remain excessively bullish, and this is a bear signal. On the other hand, company insiders (i.e., smart money) are becoming more bullish, but the value is not yet extreme, which would be a bull signal. The “dumb money” indicator is neutral. I have been of the opinion that this is a market top. If prices were to move higher from this juncture, selling would likely ensue once the market became over bought. A better, more durable bottom leading to a sustainable price would more likely be seen if investor sentiment became more bearish. And what is the best way to bring out the bears? Why of course, lower prices and breaks of support levels and widely followed moving averages. With investor sentiment essentially mixed we are nowhere and without an edge. Lower prices would be great. Higher prices will only delay the inevitable.
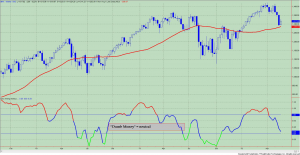
The “Dumb Money” indicator (see figure 1) looks for extremes in the data from 4 different groups of investors who historically have been wrong on the market: 1) Investors Intelligence; 2) MarketVane; 3) American Association of Individual Investors; and 4) the put call ratio. This indicator is neutral.
Figure 1. “Dumb Money”/ weekly

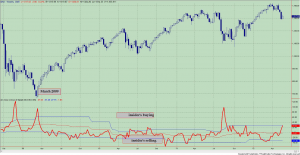
Figure 2 is a weekly chart of the SP500 with the InsiderScore “entire market” value in the lower panel. From the InsiderScore weekly report: “A market-wide Industry Buy Inflection was triggered on May 18th, the first since August 9, 2011. Buy Inflections are our strongest quantitative indicator of positive macro sentiment are triggered when buying reaches extreme levels. Presently, insider buying levels (as measured by the number of insiders buying, the number of companies with insider buying, the dollar value of purchases, etc.) is higher than normal, however, insider selling levels are normal. Typically we see insider selling levels fell to well below normal when there’s higher than normal insider buying levels. Buying is widespread, led by small- and mid-caps, though the big caps began showing a stronger buy signal as the week went on. “
Figure 2. InsiderScore “Entire Market” value/ weekly

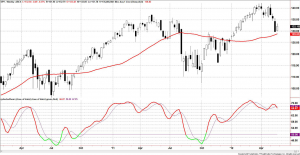
Figure 3 is a weekly chart of the SP500. The indicator in the lower panel measures all the assets in the Rydex bullish oriented equity funds divided by the sum of assets in the bullish oriented equity funds plus the assets in the bearish oriented equity funds. When the indicator is green, the value is low and there is fear in the market; this is where market bottoms are forged. When the indicator is red, there is complacency in the market. There are too many bulls and this is when market advances stall. Currently, the value of the indicator is 69.07%. Values less than 50% are associated with market bottoms. Values greater than 58% are associated with market tops. It should be noted that the market topped out in 2011 with this indicator between 70% and 71%.
Figure 3. Rydex Total Bull v. Total Bear/ weekly

Copyright © The Technical Take


