Gold Rush … to the Exit
by Wade Guenther, Horizons ETFs
Gold bullion was the poster child for lofty returns in 2011, boasting a 10.06% increase over the tumultuous period, December 31, 2010 to December 30, 2011. Surprisingly, the gold producer returns lagged gold bullion returns in 2011 with the NYSE Arca Exchange Gold BUGS Index and the S&P/TSX Global Gold™ Index achieving -13.01% and -14.32% returns respectively over the same period.
How can we profit from understanding the gold bullion and the gold producer relationship?
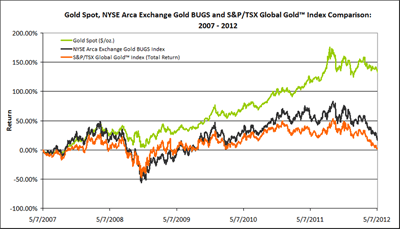
Gold Spot, NYSE Arca Exchange Gold BUGS and S&P/TSX Global Gold™ Index Returns: 2007 – 2012 (Click to enlarge)

Source: Bloomberg, between May 7, 2007 and May 8, 2012.
Gold bullion experienced daily increases 54.16% of the time over the measurement period, May 7, 2007 to May 8, 2012. The NYSE Arca Exchange Gold BUGS Index and the S&P/TSX Global Gold™ Index had daily increases 49.23% and 46.89% of the time, respectively over the same period.
The difference between gold bullion and gold producer returns became exacerbated when gold bullion returns were negative. Gold bullion experienced daily decreases of -1.00%, or less, 16.90% of the time between May 7, 2007 and May 8, 2012. However, the NYSE Arca Exchange Gold BUGS Index and the S&P/TSX Global Gold™ Index had daily decreases of -1.00%, or less, 32.90% and 31.53% of the time respectively, over the same period. The frequency of daily losing periods for gold producers was almost 2 times greater than the frequency of losing periods for gold bullion.
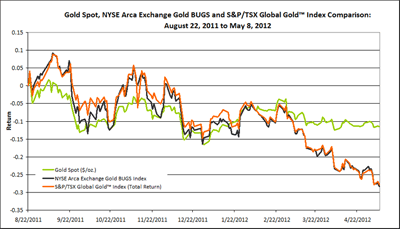
Over the shorter reference period, of August 22, 2011 to May 8, 2012, gold bullion reached a high $1897.60 $USD/oz. on August 22, 2011 and had a -13.32% return and an annualized standard deviation of 18.97%.
Gold Spot, NYSE Arca Exchange Gold BUGS and S&P/TSX Global Gold™ Index Returns: August 22, 2011 to May 8, 2012 (Click to enlarge)

Source: Bloomberg, between August 22, 2011 and May 8, 2012.
There is a noticeable divergence between gold bullion and the gold producer returns over this shorter gold bullion downtrend. The NYSE Arca Exchange Gold BUGS Index and the S&P/TSX Global Gold™ Index experienced -30.77% and -27.82% returns respectively between August 22, 2011 and May 8, 2012. The volatility of the indices were significantly higher than gold bullion with a 30.36% and 29.82% annualized standard deviation for the NYSE Arca Exchange Gold BUGS Index and the S&P/TSX Global Gold™ Index respectively, over the same measurement period.
There is a positive outlook, from analyst's consensus, for the gold producers with higher expected earnings per share in the second and third quarters of fiscal 2012.
NYSE Arca Exchange Gold BUGS and S&P/TSX Global Gold™ Index Fiscal 2012 Actual and Estimated Quarterly Earnings and Dividends

Source: Bloomberg, as of May 8, 2012.
Actual = Trailing 3 month actual weighted average earnings for the index members
Q Est = Index weighted average of the member estimates for the current quarter
Q+1 Est = Index weighted average of the member estimates for the next quarter
Q+2 Est = Index weighted average of the member estimates for the two quarters forward
Generally, analysts are forecasting dividends to decrease which could be considered a growth indicator because companies may use the retained dividends to invest in higher yielding investment opportunities versus distributing cash to the public.
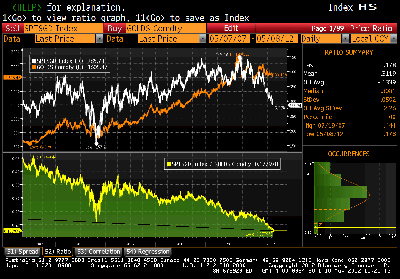
The ratio between the gold producers and gold bullion also becomes an interesting metric.
Gold Producer-to-Gold Bullion Ratio: 2007 – 2012 (Click to enlarge)

Source: Bloomberg, between May 7, 2007 and May 8, 2012.
The gold producer-to-gold bullion ratio was 0.178, as of May 8, 2012. The last significant low gold producer-to-gold bullion ratio was a value of 0.215 on October 27, 2008. Following the October 2008 low gold producer-to-gold bullion ratio, the S&P/TSX Global Gold™ Index increased 120.36% between October 27, 2008 and February 18, 2009 whereas gold bullion increased by only 34.77% over the same period.
If you believe that gold bullion returns will be positive and gold producer returns will be negative:
- HUG (1x): 100% exposure to gold bullion
- HBU (2x): 200% leveraged exposure to gold bullion
- HIG (1x): 100% inverse exposure to the S&P/TSX Global Gold™ Index
- HGD (2x): 200% leveraged inverse exposure to the S&P/TSX Global Gold™ Index
If you believe that gold bullion returns will be negative and gold producer returns will be positive:
- HBD (2x): 200% leveraged inverse exposure to gold bullion
- HGU (2x): 200% leveraged exposure to the S&P/TSX Global Gold™ Index
If you believe that gold producers will experience higher volatility than gold bullion:
- HEP (1x): Exposure to a portfolio of gold producer securities with a buy-write covered call strategy
If you believe that the price of gold bullion will experience higher volatility than gold producers:
- HGY (1x): Exposure to gold bullion with a buy-write covered call strategy
The views expressed herein are of a general nature and this Trade Idea is not and should not be considered as advice to purchase or to sell mentioned securities. Before making any investment decision, please consult your investment advisor or advisors.
ETF Performance as of April 30, 2012
Wade Guenther, CFA
ETF Research Analyst
Horizons Exchange Traded Funds
HUG Investment Objective
The Horizons COMEX® Gold ETF ("HUG") seeks investment results, before fees, expenses, distributions, brokerage commissions and other transaction costs, that endeavour to correspond to the performance of the COMEX® gold futures contract for a subsequent delivery month. Any U.S. dollar gains or losses as a result of the HUG's investment will be hedged back to the Canadian dollar to the best of the HUG's ability. If HUG is successful in meeting its investment objective, its net asset value should gain approximately as much, on a percentage basis, as any increase in the COMEX® gold futures contract for a subsequent delivery month when the COMEX® gold futures contract for that delivery month rises on a given day. Conversely, HUG's net asset value should lose approximately as much, on a percentage basis, as the COMEX® gold futures contract for a subsequent delivery month when the COMEX® gold futures contract for that delivery month declines on a given day.
HEP Investment Objective
The investment objective of the Horizons Enhanced Income Gold Producers ETF ("HEP") is to provide unitholders with: (a) exposure to the performance of an equal weighted portfolio of North American based gold mining and exploration companies; and (b) monthly distributions of dividend and call option income. Any foreign currency gains or losses as a result of HEP's investment in non-Canadian issuers will be hedged back to the Canadian dollar to the best of its ability.
HEP invests primarily in a portfolio of equity and equity related securities of North American companies that are primarily exposed to gold mining and exploration and that, as at each semi-annual rebalance date, are amongst the largest and most liquid issuers on the TSX in that sector. HEP will rebalance, on an equal weight basis, the portfolio of constituent securities on each semi-annual rebalance date.
To mitigate downside risk and generate income, HEP will generally write covered call options on 100% of its portfolio securities. Covered call options provide a partial hedge against declines in the price of the securities on which they are written to the extent of the premiums received.
HGY Investment Objective
The investment objective for Horizons Gold Yield ETF ("HGY") is to provide Unitholders with: (i) exposure to the price of gold bullion hedged to the Canadian dollar, less the ETF's fees and expenses; and (ii) tax-efficient monthly distributions, and (iii) in order to mitigate downside risk and generate income, exposure to a covered call option strategy on 33% of the securities of the Gold Portfolio. The level of covered call option writing to which HGY is exposed may vary based on market volatility and other factors.
HIG Investment Objective
The Horizons BetaPro S&P/TSX Global Gold Inverse ETF ("HIG") seeks daily investment results, before fees, expenses, distributions, brokerage commissions and other transaction costs, that endeavour to correspond to one times (100%) the inverse (opposite) of the daily performance of the S&P/TSX Global Gold™ Index.
HBU and HBD Investment Objectives
The Horizons BetaPro COMEX® Gold Bullion Bull Plus ETF ("HBU") and the Horizons BetaPro COMEX® Gold Bullion Bear Plus ETF ("HBD") seek daily investment results equal to 200% the daily performance, or inverse daily performance, of COMEX® Gold Bullion, before fees and expenses. HBU and HBD are denominated in Canadian dollars, as the U.S. dollar exposure of the underlying index is hedged daily.
HGU and HGD Investment Objectives
The Horizons BetaPro S&P/TSX Global Gold Bull+ ETF ("HGU") and the Horizons BetaPro S&P/TSX Global Gold Bear+ ETF ("HGD") seek daily investment results equal to 200% the daily performance, or inverse daily performance, of the S&P/TSX Global Gold™ Index, before fees and expenses. The Index consists of securities of global gold sector issuers listed on the TSX, NYSE, NASDAQ and AMEX.
The views expressed herein may not necessarily be the views of AlphaPro Management Inc., Horizons ETFs Management (Canada) Inc. or Horizons Exchange Traded Funds Inc. All comments, opinions and views expressed are of a general nature and should not be considered as advice to purchase or to sell mentioned securities. Before making any investment decision, please consult your investment advisor or advisors.


