The Hidden Rally in Canadian Equities
Using a Low Beta Strategy to Increase Portfolio Efficiency
Alfred Lee, CFA, CMT, DMS, Vice President & Investment Strategist
BMO ETFs & Global Structured Investments
BMO Asset Management Inc.
alfred.lee[@]bmo.com
May 15, 2012
Recent Developments:
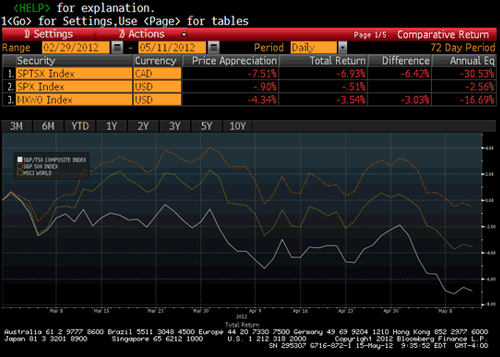
- Canadian equities got off to a strong start this year with the S&P/TSX Composite Index (TSX) rallying 6.1% on a total return basis in the two months ended February 29, 2012. The optimism of a global economic recovery has stalled since then and Canadian equities have been weak as a result, with the TSX falling 6.6% on a total return basis. U.S. equities, on the other hand, which we have recommended overweighting over the last 16 months, have been more resilient in the face of the resurfacing of European sovereign debt issues. The S&P 500 Composite Index (SPX) was down only 0.5%, also outperforming the MSCI World Index's -3.5% loss since March 1, 2012. (Chart A)
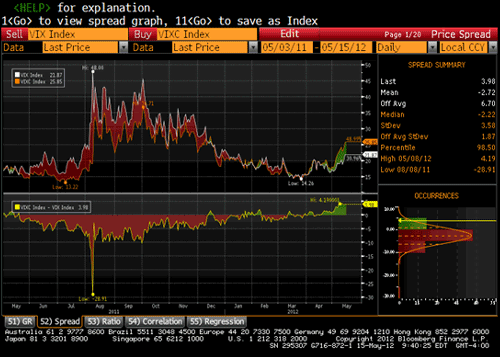
- Traditional Canadian equity benchmarks have shown weakness as of late, given the large exposure to sectors such as energy and materials. These commodity intensive areas tend to be highly sensitive to economic conditions as they are widely used in construction and urbanization projects. With increased political gridlock, especially in the Eurozone nations, there may be less clarity in the direction of policy that will be implemented in addressing the economic malaise. As a result, commodity and commodity-related areas have recently shown both weakness and increasing volatility, despite the fundamentals in some sub-groups, such as copper, remaining favourable. The implied volatility levels of the TSX have recently moved above that of the SPX, as indicated by the S&P/TSX Implied Volatility Index (VIXC) and the CBOE/S&P 500 Implied Volatility Index (VIX) respectively. (Chart B)
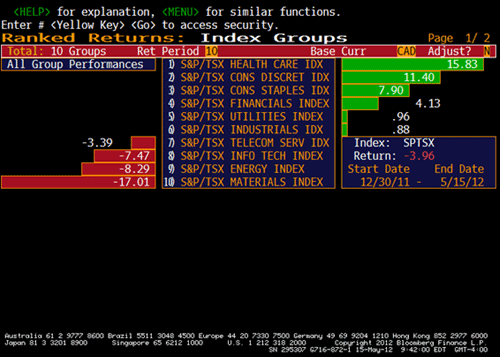
- Though the fundamentals of the TSX remains attractive, with a current price-to-earnings (P/E) ratio of 13.8x, momentum has remained weak over the last several quarters. However, there have been areas within the Canadian equity market that have shown significant strength. On a relative level, the consumer discretionary, consumer staples, utility and health care sectors have all gained considerably against the TSX so far this quarter, which has largely gone unnoticed. Low beta sectors, or those that are less sensitive to market movements, have been strong year to date (Chart C). These areas, however, tend to be under-represented in major Canadian indices and also in the portfolio of many Canadian investors. Also, interesting to note, a comparison of relative strength trends, show that both the energy and material sectors underperformed the TSX even during the first quarter, when the appetite for risk was strong.
Investment Idea:
- The portfolios of many Canadian investors remain highly exposed to commodity related areas. While we are not suggesting that investors abandon commodities, especially considering that further stimulus would cause commodity prices to rally sharply, we are however recommending also adding exposure to less-cyclical areas to reduce potential volatility that may arise. Moreover, given the aforementioned relative strength trends, some traditional measures of Canadian beta may struggle as commodity related sectors have lagged the TSX. Investors should therefore have exposure to both commodity and non-commodity related areas to reduce volatility in their Canadian equity exposure.
- The BMO Low Volatility Canadian Equity ETF (ZLB) is an efficient way for investors to diversify into less cyclical areas and sectors under-represented in traditional market-cap weighted indices. Some of the largest sector weightings in ZLB are consumer staples (20.9%), consumer discretionary (12.5%) and utilities (11.0%). Therefore, ZLB may be used as a complementary position for many investors, giving them exposure to a wider range of sectors.
- In addition, given ZLB has a much lower beta than the TSX (0.48 vs. 1.00 respectively), it may be used as a complementary position to reduce equity volatility and potentially improve the risk-adjusted returns of an overall portfolio strategy.
Chart A: VIXC Has Moved Above VIX
Source: Bloomberg, BMO Asset Management Inc.
Chart B: VIXC Has Moved Above VIX
Source: Bloomberg, BMO Asset Management Inc.
Chart C: Market-Cap Weighted Indices Are Underweight Sectors That Have Outperformed
Source: BMO Asset Management Inc.
*All prices as of market close May 11, 2012 unless otherwise indicated.
Disclaimer:
Information, opinions and statistical data contained in this report were obtained or derived from sources deemed to be reliable, but BMO Asset Management Inc. does not represent that any such information, opinion or statistical data is accurate or complete and they should not be relied upon as such. Particular investments and/or trading strategies should be evaluated relative to each individual's circumstances. Individuals should seek the advice of professionals, as appropriate, regarding any particular investment.
BMO ETFs are managed and administered by BMO Asset Management Inc, an investment fund and portfolio manager and separate legal entity from the Bank of Montreal. Commissions, management fees and expenses all may be associated with investments in exchange-traded funds. Please read the prospectus before investing. The indicated rates of return are the historical annual compound total returns including changes in prices and reinvestment of all distributions and do not take into account commission charges or income taxes payable by any unit holder that would have reduced returns. The funds are not guaranteed, their value changes frequently and past performance may not be repeated.


