Weighing the Evidence of Oil and Gold Stocks
By Frank Holmes, CEO and Chief Investment Officer, U.S. Global Investors
The MSCI Emerging Markets and the S&P 500 indices have increased double digits since the beginning of the year. Investors should be thrilled, but instead of cheers, the only sounds the markets are hearing are crickets. Many have been asking, where are the investors?
Since January 1, another $12 billion left U.S. stock mutual funds while about $100 billion went into bond funds. This continued the mutual fund flow trend that has been ongoing for several months now.
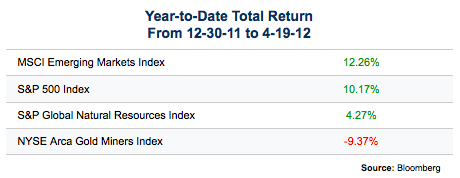
After leading markets since the rebound began in 2009, natural resources and gold took a break while severely punished stocks saw a big bounce in the first quarter of 2012. Taking a look at the returns below, the S&P Global Natural Resources Index rose only 4 percent and the NYSE Arca Gold Miners Index lost 9 percent.
As investment managers, we continuously weigh the evidence, dissecting macro factors in the market and comparing historical data. We believe this is the best way to find the next opportunity for our shareholders. Using history as our guide, we compared the performance of oil and gold companies against the results of the underlying commodities over the past three years.
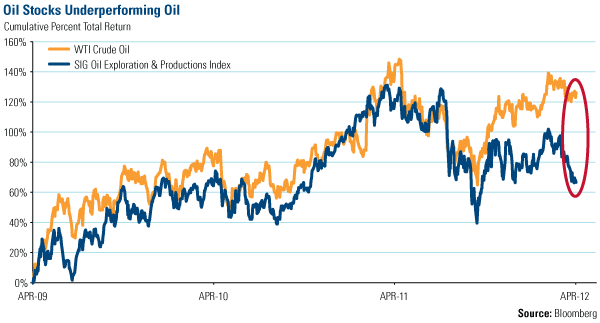
West Texas Intermediate (WTI) crude oil has seen a tremendous rise over the past three years. In April 2009, the price of oil was $46; today, it’s $104. The SIG Oil Exploration & Productions Index closely followed the rise of Texas tea from April 2009 until August 2011. That’s when the disparity between oil and oil stocks began to gradually increase.

Over the past three years, the price of oil and the index have had an average ratio of 0.21. Currently, it’s 0.26. That may not seem like a big difference but today’s ratio represents a three-year high and is a 3.13 standard deviation event. This means the divergence between oil and oil stocks is in “extreme territory” and, under normal assumptions, there is a 99 percent probability that the gap will close. Either the price of oil should come down or oil stocks go up, or a combination of both.
Gold and gold stocks are also experiencing extraordinary circumstances.
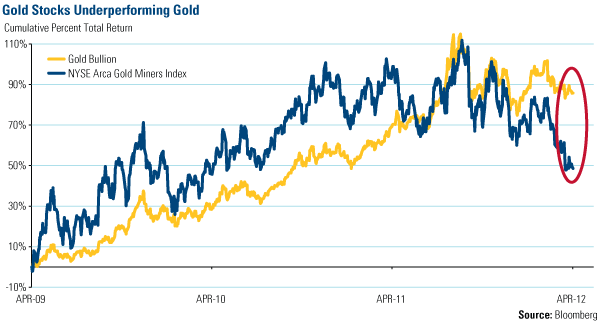
As we mentioned last week, gold equities continue to lag the price of gold, with the trend accelerating recently. Below, you can see that for most of the last three years, gold stocks have outperformed gold. Recently, though, bullion has surpassed gold stocks while gold companies have significantly declined.

The price of bullion and the NYSE Arca Gold Miners Index (GDM) have had a three-year average ratio of 0.94. Similar to oil and oil stocks, the ratio is now 1.28, a 3.06 standard deviation event.
CIBC commented earlier this week on the extreme disparity, saying the minor drop in bullion compared with the huge drop in gold stocks suggests that “a massive oversold position for the equities has occurred in the last month.” This is an “unprecedented” period for gold stocks, says CIBC.
Case Study: Newmont vs. Treasuries
Many Americans probably own gold producer Newmont Mining, one of the world’s largest gold producers. The shares were most likely acquired not through individual purchase, but rather through a fund that tracks the broad index, the S&P 500, as it is the only gold company included in the index.
The company also boasts the highest dividend yield in the industry. Newmont pays an annualized dividend yield of nearly 3 percent, which is at least a percent higher than the 5- and 10-year Treasuries.
Through dividends, gold companies including Newmont make a commitment to return capital to shareholders. While gold stocks remain at depressed levels, dividends are especially attractive, as investors get “paid to wait” for shares to appreciate.
We believe in thinking contrarian and keeping a close eye on historical trends to discover inflection points, as stocks tend to eventually revert to their means. For example, in March 2009, we noted significant changes signaling the market had hit rock bottom; following that time through the end of the first quarter, the S&P 500 Index rose more than 100 percent.
Today’s extreme divergence in oil and gold stocks and their underlying commodities presents a rare opportunity: what these stocks need now are investors to take advantage of it.


