by Guy Lerner, The Technical Take
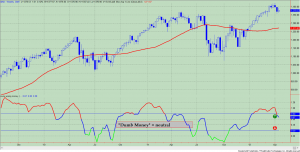
The “dumb money” indicator has become more neutral suggesting that the bulls have lost enthusiasm for this bull market. As can be seen in figure 1 (below), the indicator has dropped below the upper trading band (green arrow). From this perspective, the playbook becomes real simple. If the indicator moves back above the upper trading band, then investors are putting risk back on, and all in likelihood, this would represent the last gasp of speculation in an aging bull market. This would be worth playing for. The other option and the next best time to buy equities would be when there are too many bears (i.e., bull signal), and this occurs when the indicator drops below the lower trading band (red arrow). The best and most efficient way for this scenario to develop is by having lower prices. Period. With the indicator neutral, the bulls have lost their mojo and there is little edge.
As a reminder, the 2011 market top took over 6 months to develop. The S&P 500 traveled in a narrow 75 point range before dropping 20% over a 4 week perid. The top can best be described as a period of discussion. Is the economy sputtering? Will the European contagion effect the US economy? Will the fiscal cliff be realized? And of course, the #1 topic of discussion and the only one that matters: will there be QE3? This all sounds familiar.
The “Dumb Money” indicator (see figure 1) looks for extremes in the data from 4 different groups of investors who historically have been wrong on the market: 1) Investors Intelligence; 2) MarketVane; 3) American Association of Individual Investors; and 4) the put call ratio. This indicator is now neutral. The data shows that the optimal sign to sell is 1 week after the indicator crosses below the upper trading band. But these are optimal scenarios, and I should caution that optimal and stock market are rarely spoken of in the same sentence. The market is just too unpredictable. Who saw the May, 2010 “flash crash” or the 20% drop over 3 weeks in 2011 coming? If you hang around too long, you could be one of those casualties. Alas, there are no right answers or guarantees. These are just signposts that help us better understand the price action.
Figure 1. “Dumb Money”/ weekly

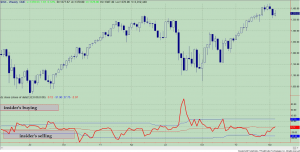
Figure 2 is a weekly chart of the S&P 500 with the InsiderScore “entire market” value in the lower panel. From the InsiderScore weekly report: “An Industry Buy Inflection, our strongest quantitative signal of positive sentiment, was triggered in the Russell 2000 last week as buyers outnumbered sellers for the first time since the final week of November 2011. It was the first time an Industry Buy Inflection was triggered since August 2011, when insiders bought at their most aggressive pace since the multi-year market bottom of March 2009. Qualitatively the activity within the Russell 2000 is similar to what we witnessed in June 2011 when an Industry Buy Inflection was also triggered.”
Figure 2. InsiderScore “Entire Market” value/ weekly

Figure 3 is a weekly chart of the SP500. The indicator in the lower panel measures all the assets in the Rydex bullish oriented equity funds divided by the sum of assets in the bullish oriented equity funds plus the assets in the bearish oriented equity funds. When the indicator is green, the value is low and there is fear in the market; this is where market bottoms are forged. When the indicator is red, there is complacency in the market. There are too many bulls and this is when market advances stall. Currently, the value of the indicator is 65.34%. This is the second week in a row that the indicator has turned down week over week. Values less than 50% are associated with market bottoms. Values greater than 58% are associated with market tops. It should be noted that the market topped out in 2011 with this indicator between 70% and 71%.
Figure 3. Rydex Total Bull v. Total Bear/ weekly

Copyright © The Technical Take


