THE LONG VIEW—BUILDING THE 3-D SHELTER
by Robert Arnott, October (end) 2011
The word hurricane is derived from “juracán,” a Spanish derivation of a word from the indigenous islanders of the West Indies. The islanders believed in a god named Juracán that either was the storm or created the great storms that descended upon them certain times of the year.1 Given the ferocity and resulting disruption of daily life, Juracán and his storms not surprisingly helped define the islanders’ culture. Columbus learned of the word shortly upon arriving in the New World and brought the term back to Spain for its eventual incorporation into most Western languages.
A half-millennium later, we use the term to describe the “3-D” storm that will likely be at the forefront of capital markets. Unending deficits, massive debt, and unfavorable demographics, like low pressure eddies over warm ocean waters, are the kinds of conditions that create stagflationary squalls over the next decade or more. With recent markets focused relentlessly on the presumed deflationary impact of a double-dip recession and European contagion, the market is focused on—to borrow a phrase from Will Rogers—a return of capital, not on capital. But for the vast majority of investors, the relevant time horizon is much longer and likely to be inflationary. Sadly, traditional portfolios are likely to leave many investors caught up in the storm surge of rising prices.
In this issue, we will suggest gradually building a “third pillar” to existing developed world equity and bond allocations. Such a portfolio should produce more meaningful real returns over a market cycle—an outcome we assert should be the ultimate goal for investors.
A Miss for Diversification and Real Return Assets
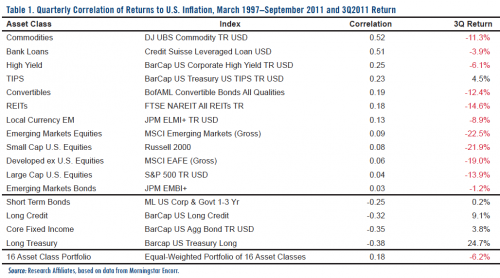
Before we delve further into the prognosis for inflation and portfolio implications, let us review the recent asset allocation environment. Table 1 shows third quarter performance of the 16 asset classes we typically use to proxy a more diversified portfolio than the traditional 60/40 equity/fixed-income standard asset allocation.
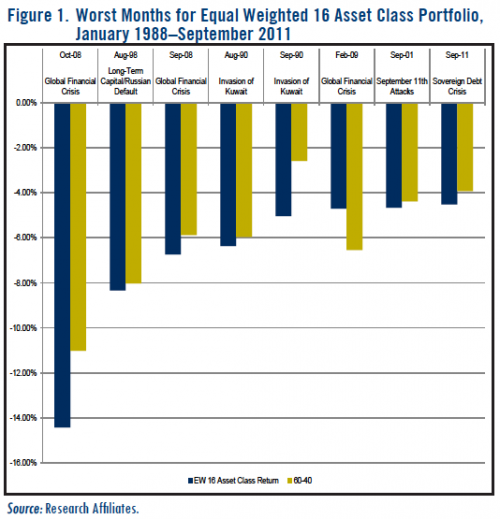
The diversified portfolio fell 6.2%, the bulk of which occurred in the quarter’s final month. September, with its –4.5% return, was the eighth worst month since 1988 for the diversified portfolio. In fact, the diversified 16 asset class mix also trailed the traditional 60/40 blend of S&P 500 Index stocks and BarCap Aggregate bonds, which posted a –3.9% return.
Since 1988, such shortfalls for diversification have largely been associated with crisis periods where massive uncertainty forces investors to first sell alternative markets, where perhaps risk is least understood. Parenthetically, there’s probably some “maverick risk” contributing as well—large losses in emerging market local currency bonds draw far more scrutiny than similar declines incurred in the S&P 500! As Figure 1 shows, the September loss for the 16-asset portfolio was exceeded only in four noteworthy periods—the 2008 Global Financial Crisis, the 1998 Long-Term Capital Management/Russian Default, the 1990 Invasion of Kuwait, and the September 2001 terrorist attacks. Interestingly, these previous crisis periods all subsequently witnessed superior results—an average of 2.7% per annum over the 60/40 portfolio—in the three years post crisis, as shown in
Of course, every crisis is different. So what is driving the seeming failure of diversification this time? Revisiting Table 1, it is clear that the markets wholeheartedly abandoned the idea of inflation protection during the third quarter. Of the 12 asset classes that have historically been positively correlated with inflation, only TIPS (Treasury Inflation-Protected Securities) produced a positive return for the latest quarter, and that was primarily due to across the board bond yield compression overriding the negative impact from its inflation protection. The remaining 11 all posted losses—averaging 12%!
Is Inflation Really a Non-Issue?
Unlike “the market,” we believe inflation will be a factor in the next decade or two because of the game-changing effects of deficits, debts, and demographics. Combined these three “Ds” could produce hurricane force headwinds to developed world growth and tailwinds to bursts of rising prices as debt levels are manipulated down to more manageable levels. Over the past two years, we have encouraged investors to place a greater emphasis on real return asset classes and the emerging markets (where our 3-D headwind is a relative tailwind). We also advocate using an expanded inflation-protection asset class toolkit and tactical management to produce substantive real returns in such an environment.2 Key tools in the toolkit: traditional real return asset classes (TIPS, commodities, and REITs) and what we have labeled “stealth inflation fighters” such as bank loans, emerging market local currency debt, high yield bonds, and convertibles—the same assets that were brutalized in the third quarter!
We have oft referred to a portfolio of these assets as the “third pillar” to be added to the mainstays of traditional stocks and bonds. Scaling the allocation of this third pillar is dependent on one’s view of the probability and magnitude of the 3-D storm. We obviously are strong believers and assert the third pillar should be the core—the largest and most central part of one’s portfolio mix.
But if these inflation-protection assets were savaged, then we must really be looking at a rapidly deflating price level, right? Wrong! Inflation is 3.9% and core inflation—inflation net of the basic things that dominate the spending of working families—is 2%. Compounding matters, inflation is calculated in a way that produces figures 2–4% lower than in the past. So, 3.9% inflation probably means 6–8%, using the old fashioned method. The difference? The old fashioned method simply asks how much prices are rising or falling. The new method asks how much quality-adjusted prices have risen or fallen. If an anti-lock braking system for a car was a $2,000 option, but it’s now standard equipment, and the car costs $1,000 more, then the car is presumed to be $1,000 cheaper. If a $1,000 computer has doubled in speed or capacity, it is presumed to have fallen 50% in price. This calculation provides little comfort to those squeezed by rising prices for basic necessities.3
Worse, the near-term direction for inflation is up, not down. The one-year inflation rate is a function of the difference between the new month’s data (coming in) and the year-old month’s data (going out). Rates for those soon-to-be-dropped months are 0.0–0.2%. That means year-end inflation will assuredly be above 4% and may even reach 5%… using the new method that systematically reduces our reported rates of inflation. Federal Reserve Chairman Ben S. Bernanke dismisses the one-year inflation rate as a temporary spike, because core inflation and three-year inflation rates are “well grounded.” Based on the year-ago months that are about to be dropped, one-year core inflation is likely to finish the year at about 3%. And, based on the three-year-ago deflationary months from 2008 that are about to be dropped, the three-year annualized inflation rate is likely to soar from 1.1% at mid-year to around 3% at year-end.
If we finish 2011 with 3% core inflation, 4–5% total inflation, and 3% three-year total inflation, the Fed’s ammunition will be tapped out. If the Fed runs the printing presses in the face of 6–10% true inflation, we are flirting with hyperinflation.
So, contrary to the prevailing current view, we are strongly inclined to believe the big issue for most investors over their relevant investment time horizon will be the wealth-eroding effect of inflation.4 As a result, the first and primary focus should be to locate and invest in asset classes that over a full market cycle (and beyond) are likely to generate superior real returns. Can some of these recently battered asset classes that meet this definition fall further? Of course. But averaging into the riskier markets, when recent markets have brought them to reasonable valuations, and accepting some downside risk if you’re early, is essential to successful asset allocation.
The First Steps to Building the Shelter
If we take the long view and focus on asset classes that are likely to excel over a 3-D dominated secular period, the recent sell-off is slowly beginning to create opportunities for establishing a meaningful third pillar within our portfolios. It’s not yet a clearance sale, but bargain-starved asset allocators are finally being offered the chance to buy some asset classes at below retail prices. Let’s review some that are currently interesting (based upon data as of September 30, 2011).
- Emerging Markets Debt sports attractive nominal yields of 6.7% (as measured by the JPM GBI-EM Global Diversified Index), a pretty attractive rate given their substantially higher capacity to service that debt.5 Emerging markets have 38% of world GDP, 81% of global population, 65% of its landmass, and 45% of worldwide energy consumption but only 11% of the debt.6
- Investment Grade Credit offers yields of 3.2% on the intermediate part of the curve (as measured by the Barclays Capital Intermediate U.S. Corporate Index), a spread of 2.2% above Treasuries, making it a far better low-risk option.
- Emerging Markets Equities have had higher dividend yields than today’s 3.2%7 only twice—during the Long-Term Capital Management episode and the Global Financial Crisis. If we add in the historical excess return from the Fundamental Index® strategy and a slight premium for earnings growth above the developed world, we can arrive at an expected long-term real return over 8%.
- High Yield Bond spreads are the cheapest since 1986. Nominal yields are 9.5%, which allows for decent forward-looking returns even after netting out a sizeable default risk.
For an asset allocator, the sweet spot is a combination of cheap assets and an improving economic backdrop. Today, we have cheaper assets and a deteriorating macro picture. Thus, the prudent course is to add incrementally to these exposures.
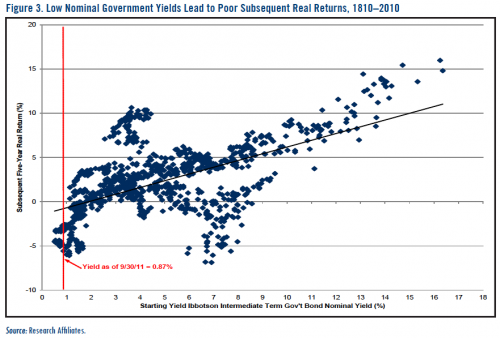
If you are buying some assets, you have to be selling others. The obvious sell candidate in a long-term inflationary environment would be developed world sovereign debt. See Figure 3, which plots the starting nominal yield of the Ibbotson Intermediate Government Bond Index (essentially a five-year Treasury) and its subsequent five-year real return. When starting government bond yields are below 1% (as they are today), subsequent five-year real returns are substantially negative—by an average of 5%! After incorporating our long-term 3-D forecast, buying and holding Treasuries is the equivalent of an islander sitting in his hut and never looking out the window for the duration of the hurricane season!
So while Treasuries and other ultra-low yielding safe haven assets will likely provide liquidity and possible short-term protection on a nominal basis, their long-term real return outlook is bleak. Thus, investors must ask themselves: What is risk? Short-term volatility or long-term impairment of purchasing power? Unless one plans to spend the bulk of one’s assets in the next year or two, we strongly assert the latter is a far greater risk.
Conclusion
Without the aid of satellite images, radar, or airplanes, the islanders had to rely on subtle signs of an impending tempest learned over generations—blooming grass, a hazy sun, a light drizzle, and the normally open ocean frigate birds converging on land. Of course, none of these provided much advance notice versus the hurricane trackers of today. Thus, these ancient people had to prepare by building crude shelters well before the storm season. Typically, these shelters consisted of a dugout with a centrally placed and sturdily anchored log from which to lash cover to nearby trees.8
Investment portfolios of today are in a similar predicament. Sadly, a 3-D hurricane season will not be a matter of waiting a handful of months but will require many years of guarded vigilance. Preparedness can and should start now while a softening economy postpones the 3-D hurricane season a year or two. Fortunately, many of the asset classes that will form the bulwark of our shelter are becoming reasonably priced. There may never be a better time to establish our third pillar, using continued weakness to embed and reinforce our ability to weather the storm. The beach days are over. It’s time to get to work—carefully and deliberately—building protection from the greatest threat to our portfolios.
Download [PDF]
Endnotes
1. See http://en.wikipedia.org/wiki/Jurac%C3%A1n.
2. See the following Fundamentals issues: “A Complete Toolkit for Fighting Inflation,” June 2009; “The ‘3-D’ Hurricane Force Headwind,” November 2009; “Debt Be Not Proud,” August 2010; “Are 401(k)
Investors Fighting Yesterday’s War?” September 2010; “King of the Mountain,” September 2011. http://researchaffiliates.com/ideas/fundamentals.htm.
3. This message was communicated to New York Fed Chair Bill Dudley at a March 2011 town hall meeting in Brooklyn. Dudley tried to explain that, while grocery prices had risen, the new iPad 2 cost
the same as the original iPad with far better features, which really meant falling prices. One attendee then shouted “we can’t eat an iPad.” See “For Fed’s Dudley, iPad Comment Falls Flat in Queens,”
March 11, 2011, http://www.reuters.com/article/2011/03/11/us-usa-fed-dudley-ipad-idUSTRE72A4D520110311.
4. Even those well into retirement or in the spend down stage of a portfolio are likely 10-plus years investors.
5. Many are surprised, especially given some of the spectacular defaults, that the starting yield is over 90% correlated with the subsequent five-year total return for the asset class. In other words,
what you see (in yield) is what you get (in return). The improving creditworthiness of the survivors—the asset class has gone from approximately 8% investment grade in 1998 to 57% today—
makes up for the blow-up losses leaving the overall portfolio no worse for the wear.
6. For a complete description of these metrics, see “Debt Be Not Proud,” 2010, Journal of Indexes, November/December: http://www.indexuniverse.com/publications/journalofindexes/joi-
articles/8237-debt-be-not-proud.html
7. Based on the MSCI Emerging Markets Index.
8. See http://www.e-missions.net/om/2weeks/hurricanes.aspx.


