The opposite is the case in structural bull markets where P/E ratios expand, sometimes dramatically so. In the last structural bull market, lasting from 1982 to 2000, P/E expansion was the single largest contributor to stock market performance, dwarfing the contribution from dividends and corporate earnings.
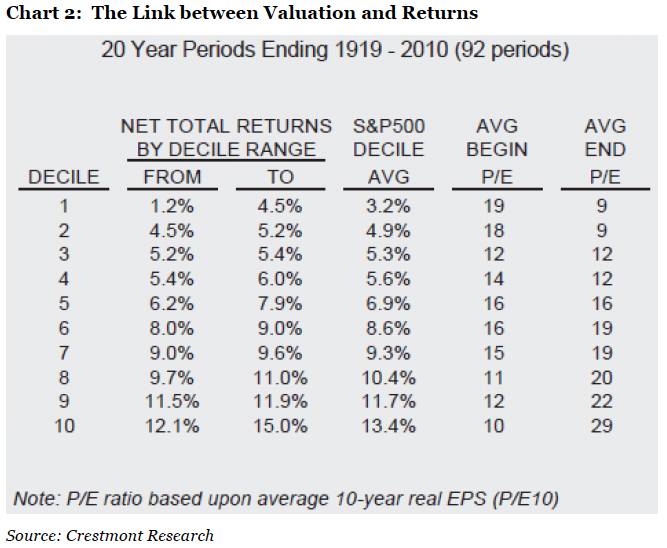
That said, our decision to turn structurally bearish on equities back in 2002 was a function of P/E multiples at the time. Following an 18 year bull market, valuations had reached dizzying levels which we considered unsustainable. It is a well documented fact that long-term equity returns correlate negatively with valuation levels at the point of entry1. As you can see from chart 2, 20-year returns have averaged 13.4% per annum, assuming you bought into the market when P/E levels were rock bottom (decile 10) as opposed to 3.2% per annum if you made your investment when P/E levels were at their highest (decile 1)2.
Our call has been broadly correct, although it has worked better in some markets than others. It is also fair to say that since we first made our call, market gyrations have been a great deal more spectacular than we would have expected, providing plenty of trading opportunities within a market that has offered only modest returns for buy-and-hold investors.
Value is on offer again
Now, nine years after having made that call, we begin to spot real value again with European equities trading at 9.4 times trailing 12-month earnings and 7.6 times next year’s earnings (see chart 3). A price-to-book value just below 1 and a dividend yield of 5.3% does not exactly make the value story any less compelling.
At first glance, European equities look a great deal more attractive than US equities; however, comparing P/E and other multiples across borders can be misleading due to the fact that the underlying economies can be at different stages in the economic cycle. Professor Shiller has addressed that problem by developing the so-called Shiller P/E (also known as the cyclically adjusted P/E or CAPE). Shiller evens out the impact from the economic cycle by calculating the P/E ratio as a 10-year average and inflation-adjusting it.
Some readers will ask the question, how is this line of thinking consistent with our equity selection approach which completely ignores valuation?
We believe that equity valuations should only be used to determine when investors enter and exit the stock market. Equity valuations should not be used for trading or for determining which equities to buy as, in our opinion, there is no correlation between valuation and relative performance.
This view is substantiated by years of research by Stockrate Asset Management in Denmark. In conjunction with Stockrate we run a hedged global equity fund which has outperformed the MSCI World Index by over 10% this year.
To find out more you can contact us at info@arpllp.com, or call us on +44 20 8939 2900.
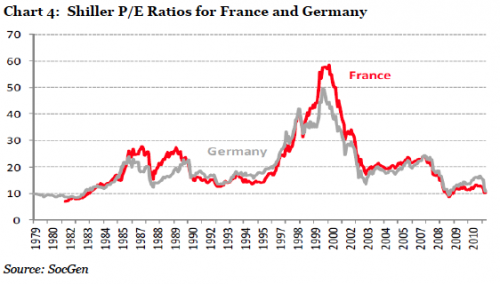
The results can be seen in charts 4 and 5. On a cyclically adjusted basis, the divergence in valuations is even more pronounced. While Germany and France are back to 1981-82 levels (chart 4), the Shiller P/E ratio for the S&P500 at almost 20 is still well above its long term average of 15-16 (chart 5).
The ability to buy European equities at 1981-82 valuations ought to make everyone sit up and listen. I remember the dark days of the early 1980s when nobody wanted equities in their portfolios. 18 years later, when earnings multiples were 50-60, everyone did. Guess who had the last laugh.


