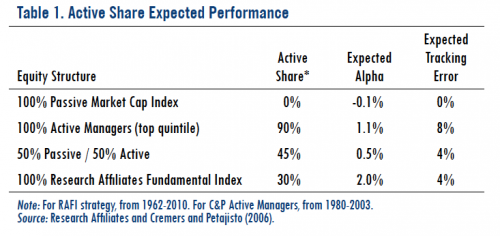
This trend has led to a “core-satellite” approach, an equity structure that blends cap-weighted indexing as the “core” part of the portfolio with highly active managers as the satellites. A hypothetical equity structure of 50% passive cap-weighted index and 50% actively managed satellite strategies produces a total equity portfolio active share of 45% with an expected excess return of 0.5%. That return potential is better than that offered by a purely passive portfolio, but it is still well shy of the return target.
RAFI® Strategy: The Best of Both Worlds
Clearly, the three equity structure approaches, which are summarized in Table 1, are suboptimal to achieve portfolio return goals. The Fundamental Index® strategy offers an attractive alternative. The Research Affiliates Fundamental Index (RAFI) strategies are able to earn returns over the capweighted benchmarks by their superior design— the approach maintains many of the attractive characteristics of traditional passive investing, and avoids the performance drag associated with linking portfolio weights to security prices. By constructing a portfolio built on fundamental weights rather than stock price—and rebalancing back to the fundamental weight anchor as stock prices mean revert—the RAFI methodology has delivered live excess returns of 2% per year on average in developed markets and more in less efficient markets.8
And the methodology has accomplished this track record across most stock markets, with 87% of FTSE RAFI indexes outperforming their respective cap-weighted index since their launch dates.9
Because RAFI portfolios are broadly diversified, they tend to have a relatively low active share of 30%. RAFI portfolio excess returns are made more attractive because they are achieved in a smooth fashion, with a low tracking error of 4% (relative to 8% for active managers). Accordingly, the RAFI approach provides the best of both worlds—strong excess returns without the big out-of-index risks active managers take—as Table 1 shows.
Conclusion

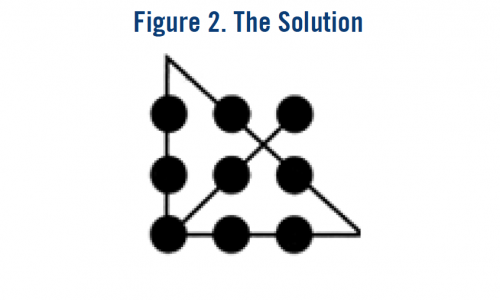
The way to solve the puzzle in the introduction is to extend one or more lines outside the matrix (or box). In other words, you must literally think outside the box to find the solution (see Figure 2).10 The puzzle of achieving superior equity performance will not be solved by staying within the box of traditional equity portfolio construction strategies. Investors need to explore newer approaches that might offer superior solutions. A RAFI-centric equity structure improves the risk-return trade-off compared to the three common equity structures implemented today. It’s an out-of-the-box approach that is easy and inexpensive to implement, without the rollercoaster ride offered by high active-share managers.
Endnotes
1. 52% in public DB plans, 54% in corporate DB plans, 60% in 401(k) plans. See http://blogs.reuters.com/reuters-wealth/2011/04/13/targeting-investment-returns-secrets-from-the-pros/ and EBRI http://www.ebri.org/pdf/briefspdf/EBRI_IB_011-2010_No350_401k_Update-092.pdf.
2. We forecast 10-year forward equity returns of 5–6%. This is based on the building block approach of 2% dividends, 1% long term real earnings growth, and 2.5% inflation. Typically, investors have a 7–8% total portfolio rate of return target.
3. K.J. Martijn Cremers and Antti Petajisto, 2009, “How Active Is Your Fund Manager? A New Measure That Predicts Performance,” International Center for Finance, Yale University (March 31, revised).
4. The average asset-weighted fund active share is approximately 65%.
5. For comparison, funds in the bottom three quintiles of active share gave up 1.2% per year on average to the index.
6. Scott Stewart and John Neumann, 2009, “Absence of Value: An Analysis of Investment Allocation Decisions by Institutional Plan Sponsors,” Financial Analysts Journal (November/December).
7. Investment Company Institute, 2011 ICI Factbook, Chapter 2. http://www.icifactbook.org/fb_ch2.html
8. A two percentage point excess return is the average of the 23 developed market FTSE RAFI indexes from November 2005 through June 2011.
9. Research Affiliates and FTSE with data from Bloomberg. 87% of the primary 44 FTSE RAFI Indexes have outperformed their respective index since inception.
10. http://www.psychologytoday.com/blog/brain-workout/200903/the-original-thinking-outside-the-box-puzzle.
Copyright © Research Affiliates


