A Second Half Surge?
by James Paulsen, Wells Capital Management, Wells Fargo
July 15, 2011
There is little the stock market likes better than a combination of rising real excess liquidity and accelerating economic growth. Fortunately, it appears increasingly likely the economy will be characterized by both in the second half. Therefore, despite a topsy-turvy year so far for stock investors, perhaps the S&P 500 Index may still reach new recovery cycle highs between 1400 and 1500 before the year is over.
The Stock Market & The Liquidity/Growth Indicator
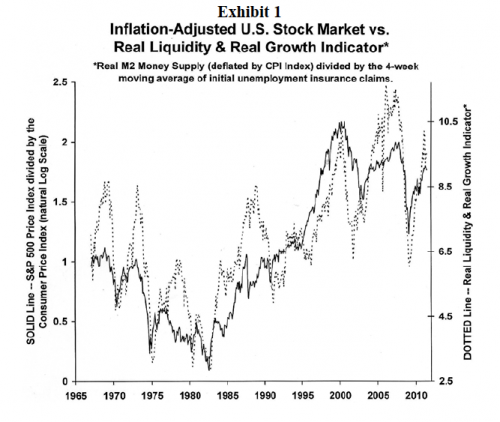
Although liquidity and growth are widely recognized as important, Exhibit 1 illustrates just how much these factors drive the stock market. The solid line is the real value of the S&P 500 Stock Price Index and the dotted line is a ratio of the level of real liquidity (i.e., M2 money supply divided by the Consumer Price Index) relative to the level of initial unemployment claims. The dotted line rises whenever real liquidity increases or whenever unemployment claims decline (a proxy for accelerating real economic growth).
As the exhibit shows, the stock market has been a product of the interaction between liquidity and growth. Sometimes the stock market has been driven higher mostly by liquidity (e.g., in 1985 the stock market surged despite a steady rise in unemployment claims because of a spurt in real liquidity), sometimes predominantly by improved economic growth (e.g., from late-1992 and the end of 1993 the stock market increased as a falling trend in real liquidity was offset by a significant decline in unemployment claims), and sometimes both have aligned at the same time (e.g., the surge in stock prices during the last half of the 1990s was chronically supported by a persistent rise in real liquidity and a slow but steady decline in unemployment claims). In a similar fashion, difficult markets have typically been associated with disappointing liquidity and real growth trends.
Most recently, as shown in Exhibit 1, the real liquidity/growth indicator peaked in February and declined until June. Investors need to consider the outlook for both real liquidity and economic growth during the rest of 2011. Will the liquidity/growth indicator continue its recent recovery higher for rest of this year or will the trends in growth and liquidity remain challenging for the stock market?
Real Economic Growth Outlook?
This year’s economic soft patch resulted from temporary forces (inclement late-winter, early- spring weather and the Japanese earthquake/tsunami) which are now normalizing or becoming a positive for growth and from events which have already reversed (i.e., rising mortgage yields, higher commodity costs, and surging energy prices). The wind increasingly is now at the back of the economic boat (pent-up demands from weather postponed purchases and construction activities, positive force from a Japanese rebuild, and a push from lowered mortgage yields and energy cost).
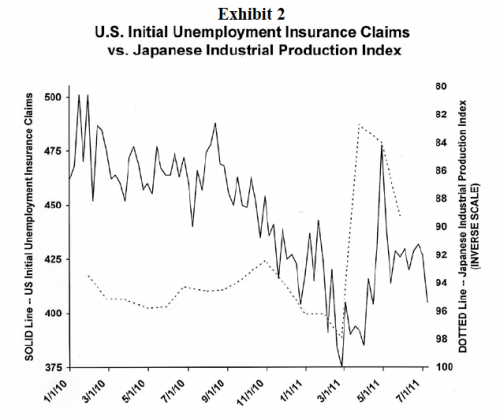
The temporary nature of this soft patch and the outlook for U.S. real economic growth is examined in Exhibit 2 which overlays initial weekly unemployment insurance claims and the Japanese industrial production index. Early this year, U.S. unemployment claims had declined to 375 thousand and then the Japanese earthquake hit. Within weeks, Japanese industrial production collapsed by more than 15 percent and within a couple months the impact on U.S. manufacturing supply chains had caused unemployment claims to surge by about 100 thousand. Recently, Japan is showing increasing signs of bouncing back from the disaster, and as its production returns to more normal levels, U.S. economic activity is also likely to reaccelerate. Already, U.S. unemployment claims are nearing 400 thousand again as Japanese production recovers. During the second half of this year, we expect initial unemployment claims to decline to between 350 and 375 thousand and for real GDP growth to average about 3.5 percent.
Real Liquidity Outlook?
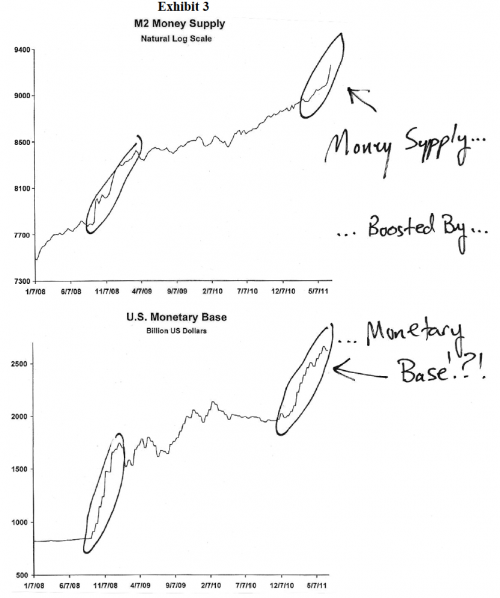
As Exhibit 3 shows, growth in the money supply has recently accelerated. Due to the lagged impact of the Federal Reserve’s QE2 program, we expect the U.S. money supply to continue to advance more quickly in the next several months. Just as they did in late 2008, bond purchases by the Fed commencing earlier this year has caused a noticeable rise in the U.S. monetary base. And, as shown in Exhibit 3, major movements in the monetary base tend to be reflected by changes in the U.S. money supply.
The growth of real liquidity should quicken noticeably in the second half of this year both because of the lagged impact of a surge in the monetary base and because the consumer price inflation rate is likely to moderate as energy and food prices decline from their torrid first half gains. A quickening in money growth combined with a slowing in inflation suggests a healthy advance in “real” excess financial liquidity during the balance of this year.
Summary
To be sure, there are many factors which ultimately will shape the investment climate in the second half of this year (e.g., the U.S. debt ceiling resolution, rating agency decisions, the ongoing saga which is the European sovereign debt crisis, ongoing municipality woes, and regulatory oversights to name just a few). In the end, though, as shown by Exhibit 1, it will be the direction of liquidity and economic growth which will drive equity prices.
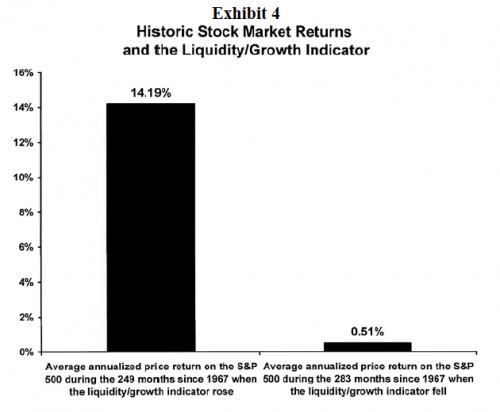
As Exhibit 4 shows, stock markets love a “rising” liquidity/growth indicator! Since 1967, during the 249 months when this indicator rose, the stock market produced an average annualized return of slightly more than 14 percent. By contrast, in the 283 months when it declined, stock investors averaged only about 0.5 percent annualized gain.
Nobody knows what the second half will bring. But the prospect the stock market will be supported by “both” rising real liquidity and accelerating economic growth should not be dismissed.
Wells Capital Management (WellsCap) is a registered investment adviser and a wholly owned subsidiary of Wells Fargo Bank, N.A. WellsCap provides investment management services for a variety of institutions. The views expressed are those of the author at the time of writing and are subject to change. This material has been distributed for educational/informational purposes only, and should not be considered as investment advice or a recommendation for any particular security, strategy or investment product. The material is based upon information we consider reliable, but its accuracy and completeness cannot be guaranteed. Past performance is not a guarantee of future returns. As with any investment vehicle, there is a potential for profit as well as the possibility of loss. For additional information on Wells Capital Management and its advisory services, please view our web site at www.wellscap.com, or refer to our Form ADV Part II, which is available upon request by calling 415.396.8000. ---
WELLS CAPITAL MANAGEMENT® is a registered service mark of Wells Capital Management, Inc.






Comments are closed.