
by Corey Hoffstein, Newfound Research
Summary
- We have noticed the market reaching a broad consensus that equities are overvalued, implying a drag on forward expected returns as valuation multiples contract.
- While there is often great wisdom in the crowd, there can also be great madness. We believe it is prudent to consider how the crowd might be wrong.
- In this commentary, we explore why valuations matter in the first place and how if we normalize for current economic realities, equities may actually be dramatically undervalued.
A little over a year and a half ago, we started more prominently discussing our outlook for traditionally allocated risk-based portfolios. For U.S. investors, these portfolios are predominantly filled with U.S. equities and U.S. fixed income.
The long-term calculus, for us, was fairly simple.
For fixed income, we needed to look no further than 10-year U.S. Treasury yields. If you buy a 10-year U.S. Treasury today and hold it to maturity in ten years, your nominal return will be the yield-to-maturity you purchased it at. Tack on a spread to account for historic credit risk (though some may say there is no spread) and we’ve got our corporate bond forecast.
For equities, we simply looked at long-term expected earnings growth, yields, and valuations. With equities overvalued, by almost any metric, compared to historic averages, our logic was that the reversion back to normal levels over the next decade would more or less wipe out the return due to earnings growth and yield.
The problem is that today we are reading this same forecast everywhere.
For every example of crowd wisdom (i.e. largely efficient markets), there is a counter-example of the extraordinary delusions and madness of crowds.
To quote Aaron Brown in Red Blooded Risk, “it can be fatal to assign a zero probability to a scenario that is in fact possible.” A crowded market view is cause for concern, and prudent risk management would be to consider exactly how this view – which we shared to date – may be entirely wrong.
Is it possible that broad U.S. equities are, in fact, not overvalued, but rather fairly, or even under, valued?
Why do valuations even matter?
When we buy a stock, our purchase price is a vote for what we believe the company is worth. Or, at least what it is worth to us at that moment in time. If we hold the stock for perpetuity, then our return will simply be the dividends we collect over time: a factor of both dividend yield and earnings growth.
We can show this by using the dividend discount model pioneered by Myron Gordon and Eli Shapiro. Their model states that p = d * (1+g) / (r - g) where p is the intrinsic value we are solving for, d is the current annual dividend level, r is the required rate of return, and g is the dividend growth rate.
If we re-arrange the formula, we find that r = (d * (1+g) / p) + g. (d * (1+g) / p) is simply the 1-year forward dividend yield (y) given current market price. So we find that r = y + g. If we assume that long-term dividend growth rate is equal to long-term earnings growth rate (e), then we get r = y + e.
As a side note, if we assume, however, that all earnings are paid as dividends, then dividend yield becomes equal to earnings yield and earnings growth goes to zero (since there is no re-investment and assuming that earnings growth does not come from another source like decreasing raw material prices). So we find that the rate of return an investor receives is simply earnings yield (r = e / p), the inverse of the common P/E valuation ratio.
So valuations come into play in several places. First is in our expected return: the higher the price we pay relative to dividends, the lower the yield. The lower the yield, the lower the return.
Second is the fact that very, very few people plan to hold a stock in perpetuity. Eventual liquidity is an important factor. Bonds are more stable not only because their coupons are more reliable than the dividends of a well-diversified stock portfolio, but also because there is a defined maturity when an investor knows they will receive back their initial investment. Stocks have no such feature. If prices plunge and stay permanently low, the only way to earn our initial investment back is by patiently waiting for our stream of dividends. At a 2% dividend yield – even with consistent earnings growth – we could be waiting decades just for a return of investment before we even consider a return on investment.
Being able to sell also unlocks the capital appreciation that occurs from dividend growth. Consider a stock with a projected $2 dividend next year, a 3% dividend growth rate, and a 7% required rate of return. Under the dividend discount model, this stock would have a value of $50.00. After one year the stock would be worth $51.50 since the new annual dividend is $2.06. However, this price growth of $1.50 cannot be captured unless we can liquidate our holding.
Paying a fair – or preferably a discount to intrinsic value – is one way to make sure we can eventually liquidate without risking significant capital loss.
It’s worth pointing out here that so far we’ve assumed we know the constant future earnings growth rate with certainty. It goes without saying that we certainly do not (though GDP serves as a good upper-bound over the long run), and poor estimation of this factor (particularly overestimation) can lead to significant overvaluation. If the market as a whole overestimates earnings growth (e.g. the dot-com bubble), you can end up with a market that initially appears fairly valued (or, at least has the expectation to be fairly valued in the future), but quickly pops when the earnings growth rates fail to materialize.
Historically, valuations have exhibited mean-reversionary behavior, creating multiple expansion and contraction pressure on equity prices. This effect has been most pronounced over 7-10 year periods, meaning that a valuation-based component can complement yield and earnings growth estimates as a factor of expected total return.
What does it mean to be expensive?
If the dividend discount model tells us the intrinsic value of a company, then the current market capitalization of the company tells us how over- or undervalued the company is. Unfortunately, estimating the perpetual growth rate of dividends, or earnings, can be difficult. So we often look towards more immediately measurable proxies for intrinsic value: earnings growth, sales, EBITDA, P/E, and book value.
Comparing current price-to-intrinsic-value-estimate versus historic levels allows us to try to quantify how over- or under-valued the market currently is.
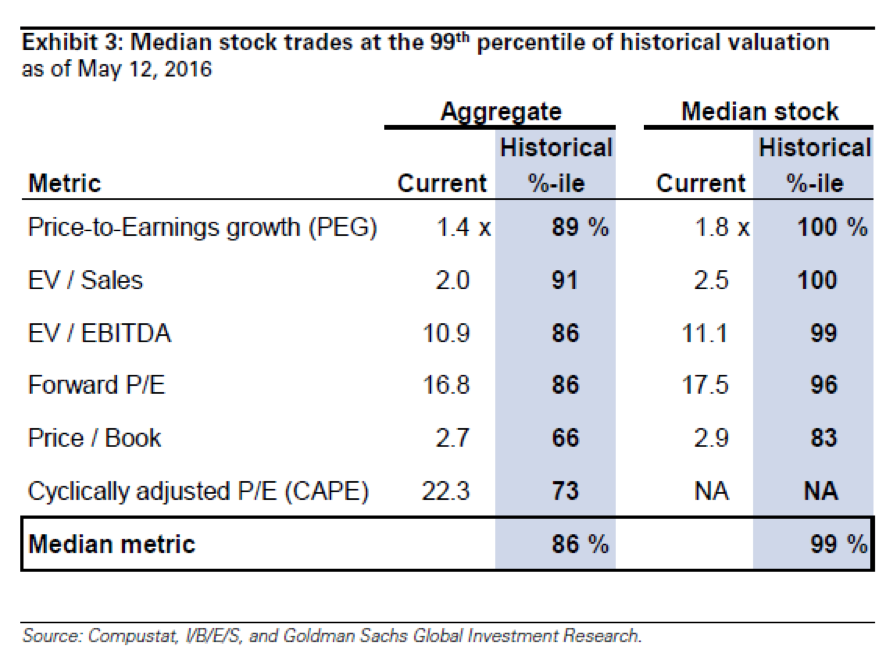
The cause for concern in today’s market comes from this method. In May, Goldman Sachs published the following table that shows us what percentile the current valuation estimates fall in versus historic levels.
While overvaluations can persist in the short-run, the expectation is that like a pendulum, valuation will eventually revert to fair value. This multiple contraction will create a drag on returns. For example, Research Affiliates estimates that this drag could be as meaningful as -2.3% annualized over the next decade.
We arrive at similar drag estimates by looking at valuation metrics and computing the current deviation from long-run averages. For example, the Shiller P/E (plotted below) has had a long-run average of 16.68. At a current value of 26.07, if we assume that earnings grow at 2%, price would have to fall by about -1.5% annualized over the next decade to bring P/E back in line with long-term averages.
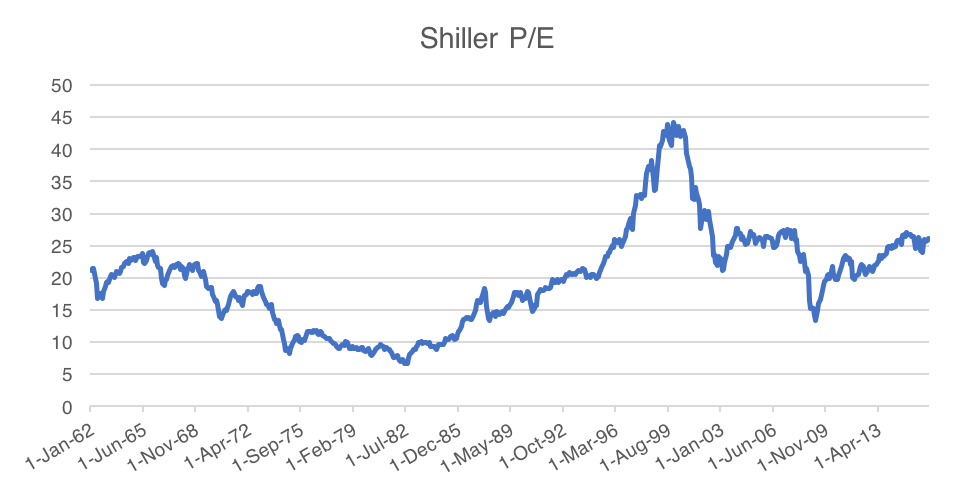
Source: multpl.com
There are two potential problems with this logic. (Important note: These are potential problems. We are not arguing one way or the other, just pointing out areas for further thought).
First, consider that if given the value 26.07 on its own, without any sort of historical time series, you would have no way to know if it were high, low, or a fair representative of value. If we created a new intrinsic value measure, V, and told you the current price-to-V measure is 12, you would have no way to know if this is high or low.
The only reason most believe the market is overvalued today is because historically, on average, the Shiller P/E has been lower. But who is to say that the historical average Shiller P/E is the right value? The logic relies on the assumption that we have had enough data, spanning enough market cycles, to average out all the potential idiosyncratic noise that might manipulate the appropriate per-cycle P/E to arrive at some cycle-agnostic appropriate long-term value.
Count us skeptical. It can be very risky to build a model based solely on historical observations without accounting for possible new regimes. For example, it took the VIX 18 years to crest 50 for the first time, but when it did during the Financial Crisis, it spiked up to 80.
The second problem lies in the factor we glossed over in the dividend discount model: the discount rate.
If we unwind the geometric series math that leads us to the dividend discount model, we get a more intuitive formula: the intrinsic value of a stock is simply the net present value sum of all future dividends.
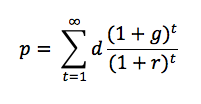
p is the price, d is the current annual dividend, g is the dividend growth rate, and r is the discount rate.
The discount rate is critical because it allows us to account for the time value of money. $100 due to us in 10 years is worth less than $100 in our pocket today (in a positive interest rate environment, at least), because we can replicate that future payment by investing less than $100 today in a zero-coupon bond.
If the discount rate is high, valuations will be lower, as we can replicate the cash flow by investing less today. If the discount rate is low, however, then valuations will be high, as we have to invest more up front to match the cash-flows.
For example, using the above formula, a stock paying a $2 dividend with a 3% dividend growth rate would be worth $103.00 in a 5% discount rate environment, but only $51.50 in a 7% discount rate environment.
What our prior discussion of expensive is missing, then, is a relation to the discount rate environment we are in.
This is particularly relevant because if our thesis is a lower-for-longer scenario, the implication is that discount rates will be lower so price values will be higher, which may make valuations look artificially inflated.
To quote Aswath Damodaran, professor of Finance at NYU, “We have to value companies in the markets that we are in, not the markets we wished we were in.”
Accounting for the Discount Rate
One way to account for the prevailing discount rate environment is to compare popular valuation metrics versus the rate.
Below we plot the historical spread between the Shiller earnings yield (inverse of Shiller P/E) and 10-year U.S. Treasury rates.
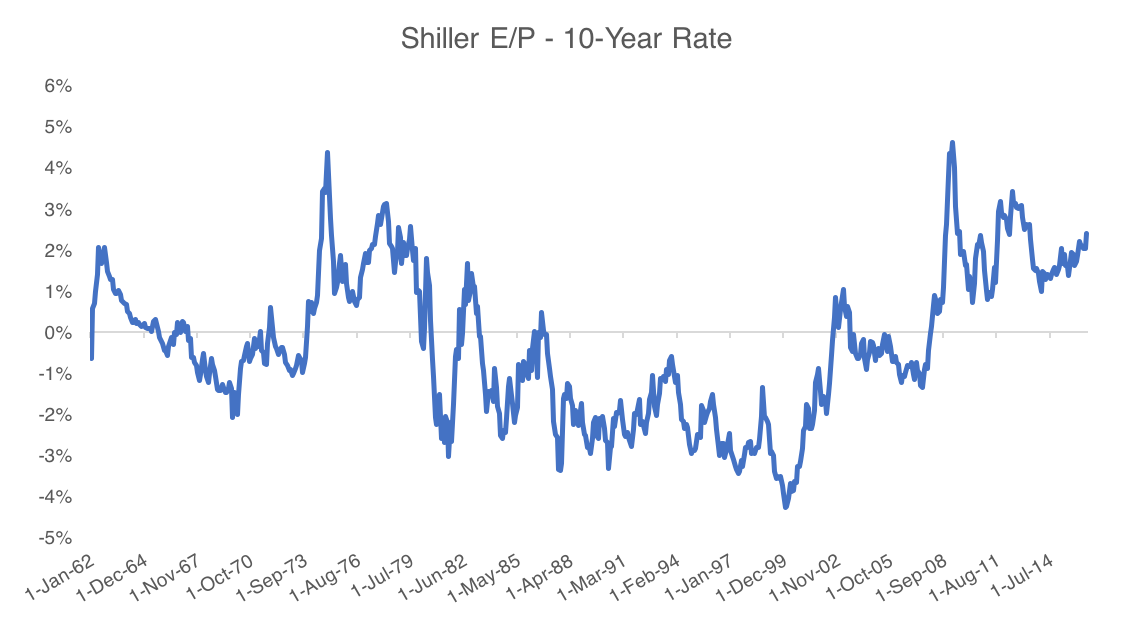
Source: multpl.com and St. Louis Federal Reserve. Calculations by Newfound Research. Shiller E/P is calculated as the reciprocal of the Shiller P/E. The starting date was selected based upon the first date that data was available for both time series.
The long-term average spread between these two is -0.35% and the current spread sits near 2%. For a reversion to the mean to occur, we’d need to see one of two realities unfold:
- Bond yields need to come up; or
- Earnings yield needs to come down.
For earnings yields to come down, the Shiller P/E would actually need to go up. In other words, to normalize in this rate environment, markets should actually be more expensive assuming that bond yields are unchanged.
By how much? With a long-term average spread of -0.35%, the Shiller P/E would need to climb to 90 times earnings.
Now a Shiller P/E of 90 may seem ridiculous at face value, but if we knew interest rates were going to sit at 0% forever, 100 or even 200 times earnings may not be an outrageous valuation. After all, some return is better than no return.
So a Shiller P/E north of 40 in the dot-com bubble was not ridiculous because of its absolute value, it was ridiculous because investors were willing to accept an earnings yield of less than 2.5% when they could have gotten a “risk-free” return of 5.85% in ten-year U.S. Treasuries.
So without accounting for the prevailing, and expected future, discount rate, valuation measures may be misleading.
Of course, this line of reasoning is just the tip of the iceberg as there are certainly many second order effects to think about (e.g. how can we expect lower discount rates to influence future earnings growth).
Has P/E been artificially inflated?
Let’s assume, for a moment, that we don’t believe that we can adequately account for the discount rate environment due to the differing influence of inflation on stocks and bonds. Or, perhaps, we believe the Fed will be normalizing rates faster than the market expects.
Might there still be a reason why stocks are cheaper than we might infer from prevailing P/E ratios?
One such reason might be the inflating pressures that large corporate cash balances and stock buybacks can create on P/E ratios.
The Influence of Cash
We don’t normally think about it, but cash has a P/E ratio. The price is $1 while the “earnings” is the risk-free rate we earn, accounting for the tax rate.
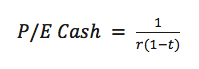
For example, at 2% risk-free rate and a 40% tax rate, cash has a P/E of about 83. As the discount rate goes lower, the P/E of cash climbs higher.
Therefore, if companies build large amounts of cash on their balance sheet during low interest rate environments, traditional P/E metrics may be artificially inflated.
While slightly outdated, Aswath Damodaran demonstrates that cash as a percentage of firm value at the end of 2014 was north of 15%. This high level of cash combined with low prevailing cash return rates inflated total market P/E from a cash-adjusted level of 11.90 up to 16.56.
The takeaway here is that while P/Es may be high, it may not be that we are paying a lot for earnings, just that we are paying a lot for cash with low earnings given the current interest rate environment. Should that cash be reinvested or rates climb, we may expect P/E ratios to fall.
The Impact of Stock Repurchases
Below we outline an argument that was originally written about by Christopher Meredith, Senior Portfolio Manager at O’Shaughnessy Asset Management. You can read his thoughts on the topic here.
Consider a company with a $200mm market cap, $100mm in book value, and $10mm in earnings. This would give the company a P/E ratio of 20 and a P/B ratio of 2.
Let’s now assume that this company becomes an aggressive repurchaser of its own shares, acquiring $50mm of its own equity.
The P/E ratio will now fall to 15, as the total market capitalization has been reduced by $50mm but the total earnings have not changed. The P/B ratio, on the other hand, will actually increase! While the numerator is decreased, so is the denominator. So we now have a market capitalization of $150mm and a book value of $50mm, leaving us with a price-to-book value of 3.
It is worth noting that while few investors quote price-to-book on a market level, price-to-book is a common input in the process index providers use to bifurcate the investment universe between growth and value. Given that the level of active repurchases has climbed from 17.9% of large stocks in the 1990s to 24.5% in the 2000s and 41.7% in the 2010s, artificially inflated P/Bs may be potentially causing a significant misclassification of securities.
The Fed’s Silver Bullet to Normality
While there is little we can do about the influence of repurchases on P/B valuations, most other points we’ve address in this commentary can be solved by an increase in discount rate. A return to “normal” would cause the P/E of cash to fall, and the Shiller E/P to 10-year U.S. Treasury spread would likely collapse to normal levels.
The problem is that the Fed might not have as much influence on rates as we hope.
First, while the Fed does set the Fed Funds rate, the relationship between that rate and longer-term interest rates is tenuous at best.
In reality, a good, but rough proxy for nominal interest rates over the long run is nominal GDP growth. If the economy grows at a rate higher than prevailing rates, it will make sense for businesses to borrow and expand, and more demand for credit should increase interest rates. On the other hand, if the economy grows at a rate lower than prevailing interest rates, then borrowing would be a losing proposition and demand for credit will fall, causing the cost of borrowing (interest rates) to decline.
In an era of high nominal GDP growth, then, we would expect higher nominal interest rates. Higher rates imply lower intrinsic value calculations.
Now GDP growth can be broken down into two source components: demographic trends and productivity growth. Over the last 50 years, U.S. GDP growth has been buoyed by strong demographic trends (baby boomer generation) and productivity growth (technological innovation).
Going forward, even if we assume that productivity growth remains constant, demographics trends are more or less already locked in. The result is not pretty.
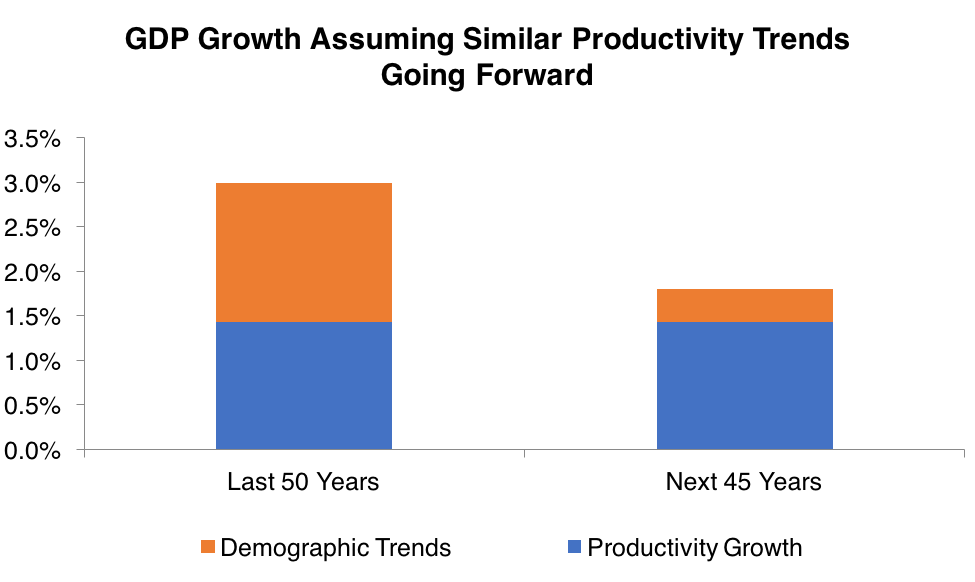
Data Source: Federal Research of St. Louis and United States Census Bureau. Calculations by Newfound Research.
Given the expectation for a reduced GDP growth level over the next 45 years, the resulting expectation is for a reduced prevailing interest rate.
The final conclusion of a structurally reduced prevailing interest rate is structurally increased valuations.
In other words, the long-term P/Es we may be using as anchor points may be totally meaningless for tomorrow’s market.
Conclusion
There can be wisdom in crowds, but also the risk of madness. Most research we’ve read in the last 6 months has converged upon the agreement that stocks are overvalued and therefore the forward outlook for equities must be poor due to the drag of expected multiple contraction.
Prudent risk management dictates that there is little harm in assigning a small probability to a zero-probability event, but potential calamity in assigning a zero probability to a possible event. Therefore, we must accept the possibility that the crowd consensus may be on the side of madness.
In this commentary, we sought first to outline why we care about valuations at all, and then try to identify several potential reasons why stocks may not actually be overvalued at all.
- Valuations relative to historical averages are meaningless without the context of the economic environment they existed in; specifically, the interest rate environment. Comparing current earnings yields versus 10-year Treasury rates, we find that stocks may actually be undervalued.
- The high levels of cash currently held by U.S. companies, combined with the low present interest rates, may actually be artificially inflating the P/E of the market.
- The Fed may not actually have a silver bullet to hike rates and create a “normal” interest rate environment, as nominal interest rates should actually be tied closely to nominal economic growth. The expectation of reduced demographic trends going forward creates an expectation for reduced GDP growth. Reduced GDP growth implies a reduced interest rate and higher valuations. Simply, historical averages for valuations created in higher economic environments may not be applicable going forward.
So given this evidence, have we convinced ourselves that the market is not overvalued? The jury is still out. After all, given enough market data we are sure we could torture it to make just about any point. Nevertheless, we are firm believers that only by understanding both sides of an argument can we prudently construct portfolios that can be robust to alternative future economic realities.
Client Talking Points
- You may be hearing that equities are currently highly overvalued, which may give you pause for concern given your memory of what happened during the dot-com bubble.
- It is important to recognize first that high valuations are not necessarily a catalyst for a market crash. Rather, high valuations are normally seen as a drag on future returns, like gravity.
- However, valuations do not exist in a vacuum. Interest rates were much higher during the dot-com bubble. Given today’s low interest rates, and the expectation that rates will be structurally lower for the foreseeable future, the expectation is that historical average valuations are not necessarily the appropriate reference point for determining whether the market is overvalued or not.
Incoming search terms:
- are bonds overvalued or undervalued
- equities overvalued
- most undervalued stock 2016
- undervalued dividend stocks 2016