by Phillip Murphy, Vice President, North American Equities, S&P Dow Jones Indices
Wealth drawdowns and volatility of returns are not the only risks facing defined contribution (DC) retirement plan participants.
Those relying primarily on retirement plans and other DC plans for retirement income also need to address longevity, inflation, and variability in the price of income. Furthermore, many traditional guidelines for withdrawal policies are simply insufficient for real-life application. We hear a lot of debate around withdrawal rates expressed as a starting percentage of capital that is adjusted up each year for inflation—should the initial rate be 3%, 4%, or even 5%? Such rules are naïve in that they fail to take into account the changing price of income, and they tend to be backward looking. They are also usually accompanied by statements of probability—e.g., there is a 95% chance you will not run out of money, etc.
Can investors relate to statistical confidence levels? If you tell someone that she has a 95% chance of not running out of money, this may sound pretty good. However, if you tell that person that if she had 100 lives, you would expect her to run out of money in five of them, so things may not look so good. The results in those five trials are too catastrophic for comfort.
Retired investors generally seek to retain control over their capital, and they need sensible strategies for funding consumption throughout their lives. Sustainable systematic withdrawal policies must regularly take asset value and the price of income into account. M. Barton Waring and Laurence B. Siegel do a great job of explaining this in a 2015 Financial Analysts Journal article titled “The Only Spending Rule Article You Will Ever Need.”
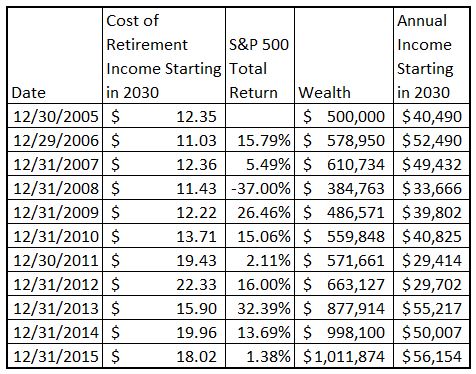
How variable is the affordability of income? In conjunction with the S&P STRIDE index series, S&P DJI seeks to calculate the cost of inflation-adjusted income starting at specific points in time. Exhibit 1 shows the U.S. dollar price of inflation-adjusted income starting in January 2030 and lasting 25 years. It illustrates how many U.S. dollars would be required at the end of each year from 2005 to 2015 to lock in USD 1 of real income per year starting in 2030. The table also shows annual total returns of the S&P 500, as well as the wealth and income performance of a hypothetical investment in the S&P 500.
We begin with USD 500,000 invested in the S&P 500 at the end of 2005. At that time, 2030 income cost USD 12.35 per future real U.S. dollar, so I could have spent my USD 500,000 to lock in USD 40,490 per year (starting in 2030). However, I thought I could eventually end up with more future income by investing in the stock market. After one year, my wealth had grown to USD 578,950, and the price of 2030 income dropped from USD 12.35 to USD 11.03. I could have sold my stocks to lock in USD 52,490 of future income, but I stayed invested. I did this every year; by 2015, my wealth grew to USD 1,011,874, and the income I could afford to lock in grew to USD 56,154.
However, there are some striking observations buried within the table. First, during the entire period, my account value grew at an annual rate of 7.3%, but my future income grew at an annual rate of only 3.3%. Next, as recently as 2012 and in spite of the fact that my wealth had grown to USD 663,127, I would have been better off locking in future income in 2005, when I could have acquired USD 40,490 per year rather than only USD 29,702!
Changes in wealth do not proportionally translate into changes in future income. For retirement savers, keeping an eye on expected future income may be just as important as account balances—if not more so. Since no one knows the future sequence of investment returns or income cost, the wisest policy may be to lock in future income a little bit at a time.
This article is a publication of S&P Dow Jones Indices LLC. © S&P Dow Jones Indices LLC 2016. S&P® is a registered trademark of S&P Financial Services LLC. Dow Jones® is a registered trademark of Dow Jones Trademark Holdings LLC. S&P Dow Jones Indices LLC is not an investment advisor. This publication is not a recommendation by S&P Dow Jones Indices to buy, sell, or hold a security, nor is it considered to be investment advice.
Copyright © S&P Dow Jones Indices