
by Blaine Rollins, CFA, 361 Capital
Increasingly, we’ve been thinking about the way that investors view risk in the planning stages, as opposed to how they experience risk in real time. And no surprise, there is a not-so-insignificant delta between those perspectives. The problem lies in the fact that whether running forward-looking simulations, or drawing conclusions from historical data, both the likelihood of a loss, and the size of the potential loss that an investor could experience over the full investment horizon will appear to have been underestimated when viewed on a continuous basis with hindsight.
That is a bit of a mouthful, so let’s unpack that.
Almost all risk and return statistics used in the investment industry, at least those for public consumption, are based on monthly returns. And, when you use monthly returns to calculate a statistic-like drawdown, there is a high probability that the apparent drawdown will be less severe than if you were to calculate it using daily returns. Of course, the actual drawdown is the one based on daily returns. That is what investors live through; they couldn’t care less what the drawdown may happen to look like after the fact when monthly returns are used to calculate the pain they felt in the moment.
The same is true when running simulations over say a five, seven, or 10-year horizon, as is common in the investment planning stages. The probability of a loss and the size of that loss over the entire time period from point A to point B is lower than when measured on a continuous basis. In other words, in order to “achieve” a 10% loss, an investor may have to stomach a 25% loss along the way. Mark Kritzman at Windham Capital Management has written extensively about this over the years, and likely does a better job of explaining it, so we’ll let him do so.
“End-of-horizon estimates of exposure to loss drastically understate a portfolio’s vulnerability to losses along the way. The moderate investor has only about a 1% chance of losing 10% or more at the end of five years, but there is a 15% chance that the portfolio will depreciate by at least that amount at some point along the way, and it increases to 36% if we expect a turbulent period to prevail. These are huge differences.” – Windham Capital Management
With that knowledge in hand, at a minimum, the nature of the conversation with the client should change to ensure that the true potential for loss along the way is understood. However, since we know that there is a world of difference between being able to comprehend this issue intellectually, and actually being able to handle it emotionally in the moment, we’d suggest that you build portfolios that address the issue directly. It is, after all, the destination and not the journey that matters to investors, but if they stop climbing for fear of heights, they can’t reach the summit.
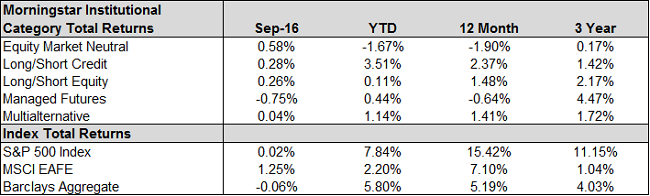
Most strategies and markets were was essentially flat for the month, while the MSCI EAFE Index was up just over 1%.


SEC Commish: Don’t Expect Derivatives Rule Vote This Year
No news is good news? While it won’t have any effect on the funds we run here at 361 Capital, as we’ve written in the past, we aren’t fans of the proposed legislation because it simply doesn’t measure risk appropriately, and thus fails to protect shareholders.
Hedge Funds Cost N.Y. Pension Plan $3.8 Billion, Report Says
Good ol’ Henry Hindsight has been busy of late, evidently penning a report for the NY Department of Financial Services, claiming that hedge funds cost the NY Pension Plan $3.8 billion in fees, and more importantly, opportunity costs. You see, all they had to do was invest in equities, and performance would have been much better. Too bad they didn’t see the data on the collapse in oil prices from a peak of $115 per barrel in June 2014 to under $35 at the end of February 2016. Clearly they should have just shorted it at the top, right? That’s what we would have done.
Hedge Funds May See Up to $8.7 Billion Windfall From Calstrs
It seems not everyone is giving up on hedged strategies. CIO Christopher Ailman explained that allocating money to macro and trend following strategies is part of a new “Risk Mitigating Strategies” asset class for the almost $200 billion plan.
Hedge Funds See Liquid Alts Edge in Global Macro
Nico Amato, head of alts portfolio management at Wilshire Funds Management says, ““There are global macro strategies that are very transferable from the private marketplace to the [1940 Investment Advisors Act] space,” he says. “You are seeing a bunch of players step in.”
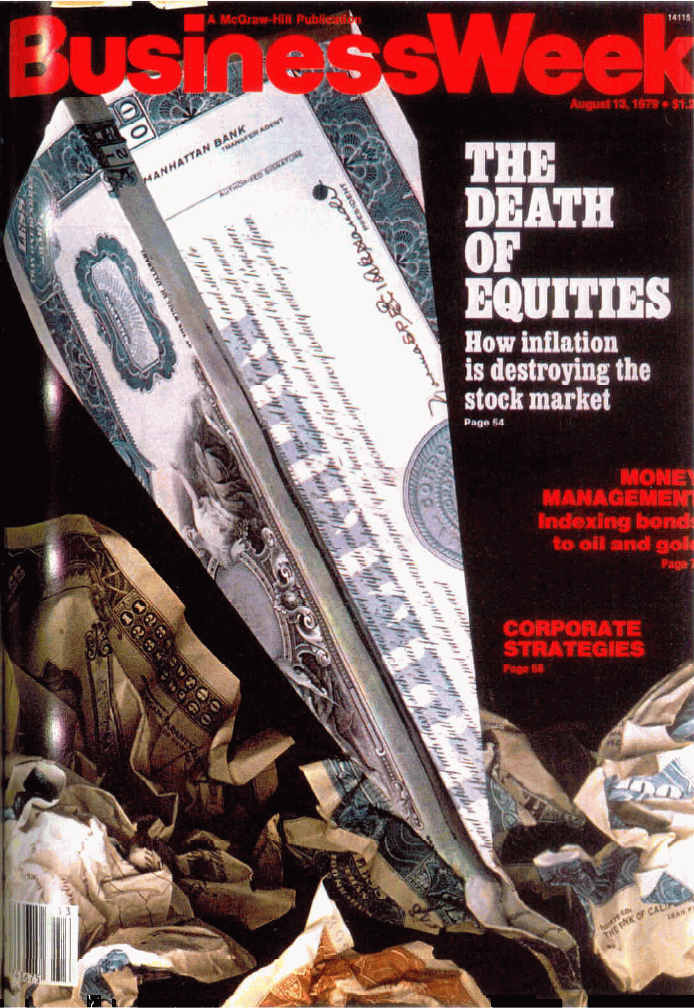
While not exactly alts focused, The Dying Business of Picking Stocks from the WSJ speaks to the troubles of active management more generally. We can’t help but be reminded of the BusinessWeek cover in 1979 titled “The Death of Equities.” Stocks seem to have done reasonably well since then.
Education
Measuring Risk
As was discussed in the introduction, we’ve observed that a prominent way investors view risk when constructing a portfolio is to measure the probability of not meeting their end of horizon goal and/or the probability of having an unfavorable (i.e., negative) outcome at the end of their stated investment horizon. As was mentioned above, we feel this is a fundamentally flawed approach; we have learned all too well that the path taken can matter just as much as the destination reached. To expand on the idea, we did some fairly simple modeling of a 60% S&P 500 Index/40% Barclays Aggregate index portfolio. Using data beginning from March 1, 1994 through September 30, 2016 we created 1,000, five-year horizon, daily return streams via bootstrapping the daily portfolio returns. For those unfamiliar with the concept of “bootstrapping,” it is a methodology for randomly sampling from a dataset, allowing for richer analysis to be performed. For further explanation of statistical bootstrapping click here. Below are the summary results:
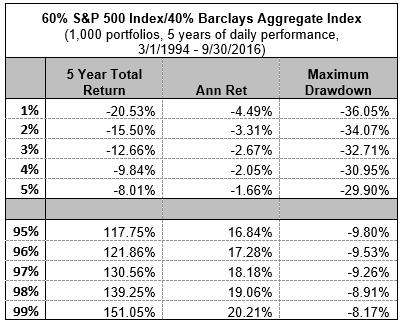
Expanding on Kritzman’s referenced earlier in this issue, we show that an investor in the above portfolio has a roughly 4% chance of losing 9.8% or more at the end of five years. However, looking at the intra-holding period over the same five year period, the investor has a roughly 95% probability of experiencing at least a 9.8% loss at some point along the way. This may be perfectly acceptable to the end investor. However, it is important that this concept of intra-horizon loss probabilities vs. end of horizon probabilities is well understood. Otherwise, to quote ourselves: “It is, after all, the destination and not the journey that matters to investors, but if they stop climbing for fear of heights, they can’t reach the summit.” And reaching the summit is ultimately what it is all about!
Copyright © 361 Capital