
Unfortunately the negative market influences continue to pile up on the negative side of the ledger. As a result, Santa still likes you but he hates your investment portfolio this year. Here is what Santa has hidden behind the doors of the 2018 Investment Portfolio Advent Calendar this year…
1- “I am Tariff Man”
2- Huawei CFO Retreat
3- An exiting John Kelly
4- S&P 500 Death Cross
5- Broken Brexit
6- Fruitcake
7- A Yellow Vest of Paris
8- Robert Mueller Schedules a Press Conference
9- A Border Wall or Government Shutdown
10- Some More Fed Tightening
11- M. Cohen & Affair Hush Money
12- Raiders vs. Niners
13- Global Growth Slowdown
14- A Flat/Inverted Yield Curve
15- Further Credit Deterioration
16- M. Cohen & Trump Tower Moscow
17- Financial Stock Underperformance
18- Another Netflix Holiday Special
19- Falling Home Sales
20- Bitcoin Liquidations
21- Khashoggi/MBS/Jared
22- An Oil Bear Market
23- A Volatility Index > 20
24 – 2019 Profit Margin Uncertainty
25- A Stocking Full of GE, DB & GM
Gee, Thanks Santa. You were so nice to investors for eight of the last nine Decembers. This must be the mean reverting month of December. So much more to think about in the last two weeks. U.S. job growth is clearly pulling up from its torrid pace. Global growth continues to slow maybe taking non-tariff prices with it. This slowing combined with the pullback in risk and the financial markets could give the Fed a reason to wait even longer for more data. A rate hike still seems certain for December, but now the odds for hikes in 2019 are pulling in rapidly. Equity valuations are falling but we will likely need to revise forward earnings estimates even further given some of the recent reads from the auto companies, the home builders and BASF who hit us late Friday. Credit is still breaking down as investors flock to buy Treasuries. In the short term, Equities will still be challenged as earnings get cut and credit spreads widen. Cash is still an investors best friend while we look to make money on both the long and short side of the portfolio. Stay defensive and be careful of the big guy in the red suit bearing gifts.
To receive this weekly briefing directly to your inbox, subscribe now.
So expectations for Fed Funds rate hikes in 2019 are coming in quickly…

(WSJ/DailyShot)
Goldman Sachs Group Inc. expects the Federal Reserve to raise interest rates this month, but said the probability of a follow-up move in March has fallen to slightly below 50 percent.
Holding in March would likely coincide with a volatile period for markets as the 90-day trade war truce between the U.S. and China is due to end at the start of that month, Chief Economist Jan Hatzius wrote in a Dec. 9 note.
Even so, there’s still a good chance that the Fed hikes in March given a positive fiscal impulse and a funds rate that remains in neutral territory.
“We emphasize that this is a close call,” Hatzius said. “Moreover, our forecast of no hike assumes that the median number of 2019 hikes in the December dot plot moves down from 3 to 2; if the median instead stays at 3 hikes, the probability of March would increase again.”
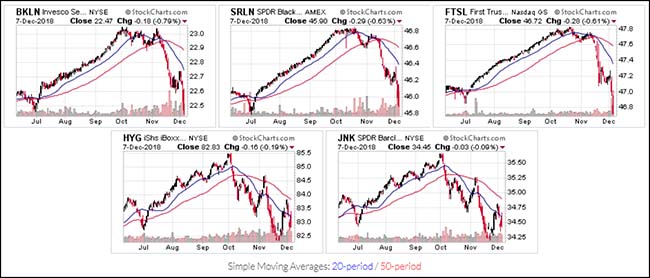
Remember two months ago when Bank Loan funds were all the rage?
Okay, who yelled fire in the Bank Loan movie theater last week? Actually, as you can see below, the downward pressure had been building since Junk Bonds rolled over hard in October (see HYG and JNK charts below). Bank loans are less liquid assets so when redemptions hit their liquid vehicles (ETFs and Mutual Funds), prices can break. Just like they did last week. If this continues, banking stocks (which are now in a bear market) will continue lower because they are basically an entire portfolio of bank loans.
Even investment grade credits continue to widen…

(WSJ/DailyShot)
You just can’t get away from looking at the yield curve…
@Schuldensuehner: Ahead of the last 9 recessions the yield curve has inverted every time. As such, if you still trust it as an indicator you may feel that more risk premium should be attached to credit and equities at these levels where the curve is a small accident away from inverting, DB says.

A simple rule of thumb: Do not own stocks when the 50 day moving average crosses below a flat/down 200 day moving average…
@G_krupins: $SPX going back 20 years. Red circles when 50 day crossed below flattish 200 day. Not a bullish sign obviously. We’ll see how it plays out

Never say Never #1…
Records were made to be broken. December’s stock performance could easily eclipse October’s -6.9% return.

Never say Never #2…
Even if I thought this was possible, I don’t think that I would ever go out and say it publicly. Because just as you make the claim, the investment gods are winding up a baseball bat and swinging at a ball with your name on it.
“It’s inconceivable that we would ever lose money on an investment,” Cardinale said, a hint of his native Philadelphia accent coming through. “If something comes out of left field, we’ll grind it and work through it. I don’t care if we hold it forever, we’ll get back to where we need to be. I will never lose anybody’s money.”
An look at previous ugly Q4 performances and the surrounding environment…
@OddStats: Here’s where we rank so far this year vs $SPX Q4’s since 1923 when the index began.

Did technology stock prices lead SV/SF housing prices lower?

Toll Brothers didn’t have positive housing news last week…
Douglas Yearley, Toll’s chief executive, said that despite a healthy economy, the company saw demand moderate in its fourth quarter ended October 31. “In November, we saw the market soften further, which we attribute to the cumulative impact of rising interest rates and the effect on buyer sentiment of well-publicised reports of a housing slowdown. We saw similar consumer behaviour beginning in late 2013, when a rapid rise in interest rates temporarily tempered buyer demand before the market regained momentum,” he added in a statement. Unsettling investors, the Pennsylvania-based company said orders, which are a useful indicator of future revenue, dropped 13 per cent year-on-year in the fourth quarter, against market expectations for a 6.5 per cent rise. It was the first quarterly fall in the measure since the third quarter of 2014.
To receive this weekly briefing directly to your inbox, subscribe now.
Remember back when stock buybacks used to always be there to bail the market out?

(WSJ/DailyShot)
This surprise late Friday: Earnings pre-announcement from a global major will not bode well for other multinationals…
BASF now expects a considerable decrease in EBIT for the fiscal year 2018 in the range of 15% to 20% compared with the prior year. BASF previously forecast a slight decline of up to 10% compared with the prior-year figure. The significant decline in EBIT before special items compared with the prior-year figure is mainly attributable to the Chemicals segment. Furthermore, BASF’s business with the automotive industry has continued to decline since the third quarter of 2018; in particular, demand from customers in China slowed significantly. The trade conflict between the United States and China contributed to this slowdown.
A tough week for stock investors but a good one for Bond and Commodity investors…

(12/7/2018)
A Dow Theory disappointment…
It doesn’t help that the big ticket international customers are being told not to travel overseas either due to trade war retaliation, yellow vest rioting or now future Brexit shortages.

A risk-off week across the U.S. stock sectors…
Bear market pullbacks in Oil & Gas, Biotech, Semis, Banks and Apple.

(12/7/2018)
The last 90 days show you how defensive this market has gotten…

(@HORANCapitalAdv)
Something is wrong with the stock market when Utilities is a leading sector…

This chart is eye candy for investment geeks…
Notice how better the returns are in 2018 versus 2008 yet more asset classes have negative returns this year. Also notice the 11 year outperformance of SPY and QQQ over all other assets. I have to believe that some of those worst performing asset classes will be much better performers going forward. I would place some chips on Emerging Market stocks.

(@charliebilello)
Emerging Market equities would seem to have support here on a relative basis versus Developed Markets…
Of course global trade wars could shift the landscape if they are negatively impacted and their earnings potential declines.

The Leuthold Group also notes the extreme discount in EM and Foreign Stocks…
Foreign stocks have been “cheap relative to the U.S.” for years, but the Normalized P/E gap between the U.S. and foreign developed markets (World Ex-USA Index) has exceeded ten points for the first time ever (26.2x versus 15.6x).

I still can’t look away from this Value versus Growth chart…
And it should become even more attractive if Morgan Stanley is getting client pushback on it.
Cheap, stolid “value” stocks have been left in the dust by racier “growth” stocks since the financial crisis, but Morgan Stanley reckons that 2019 will see “a major leadership change occurring from growth to value which could be more long-lasting than most appreciate”, pointing to their relatively low prices and how growth stocks are more sensitive to higher bond yields. After a long bout of underperformance, which by some measures stretches back decades, this is an out-of-consensus call by Morgan Stanley’s analysts. As they noted in a follow-up report: “While pushback wasn’t overwhelming, clients didn’t exactly embrace our views, with the least support for value over growth and international stocks outperforming the US.”

The Phoenix market clearly needs an Air Conditioned Scooter rental company right now…

(WSJ)
80 years ago, Bette Davis gets divorced for the best reason ever…
Oscar’s loss. But at least he got a little gold statue named after him.

(@nytimesbooks)
To receive this weekly briefing directly to your inbox, subscribe now.
Finally, we are honored to be recognized by Pensions & Investments as a Best Places to Work in Money Management for the 3rd year in a row.