Trading in stocks and commodities has been distorted this week by the US Thanksgiving holiday. Often during this week, US stock markets go quiet at noon on the Wednesday as the heavy hitters head home for the holidays. They remain closed the Thursday for the annual day of turkey and football, and remain quiet through a shortened Friday session while the big market players are out at the malls for Black Friday.
This year, it appears that the looming holiday pulled a week’s worth of selling pressure whether from those fearful of holding stocks through a long weekend, or those forced out of the market by margin calls into Monday and Tuesday. Wednesday finds stocks and energy commodities on the rebound. With the bears backing off and leaving the field to short covering and bargain hunters, we have seen broad based gains.
Canadian markets have benefited from bears releasing their stranglehold on oil prices while cold weather has kept natural gas on its hot streak. Wednesday’s S&P/TSX gains have been broadly based. Friday brings Canadian inflation and retail sales numbers. Speaking of retailing, retailers on both sides of the border may attract attention over the next week as results come in from the big Black Friday / Cyber Monday weekend, the busiest time of the year for shopping in the States and increasingly in Canada too. Even in a weak market to start the week, US retailers had been among the weakest groups suggesting that expectations for holiday season sales are running low at the moment. By early next week, we’ll know if fears were overdone or on the mark.
This year has seen a series of rolling takedowns across world markets. While indices have all been in gear at some points in time, at others, we have seen different markets moving in different directions, confusing investors. In this issue of Equity Leaders Weekly, we look at a change in leadership that appears to be underway in equity markets. Technology, one of the leading groups of the last advance and one of the last holdouts to a market correction has gone off a cliff lately. On the other hand, emerging markets such as India and China, which had been among the first markets to sell off back in the summer, are showing signs of bottoming out.
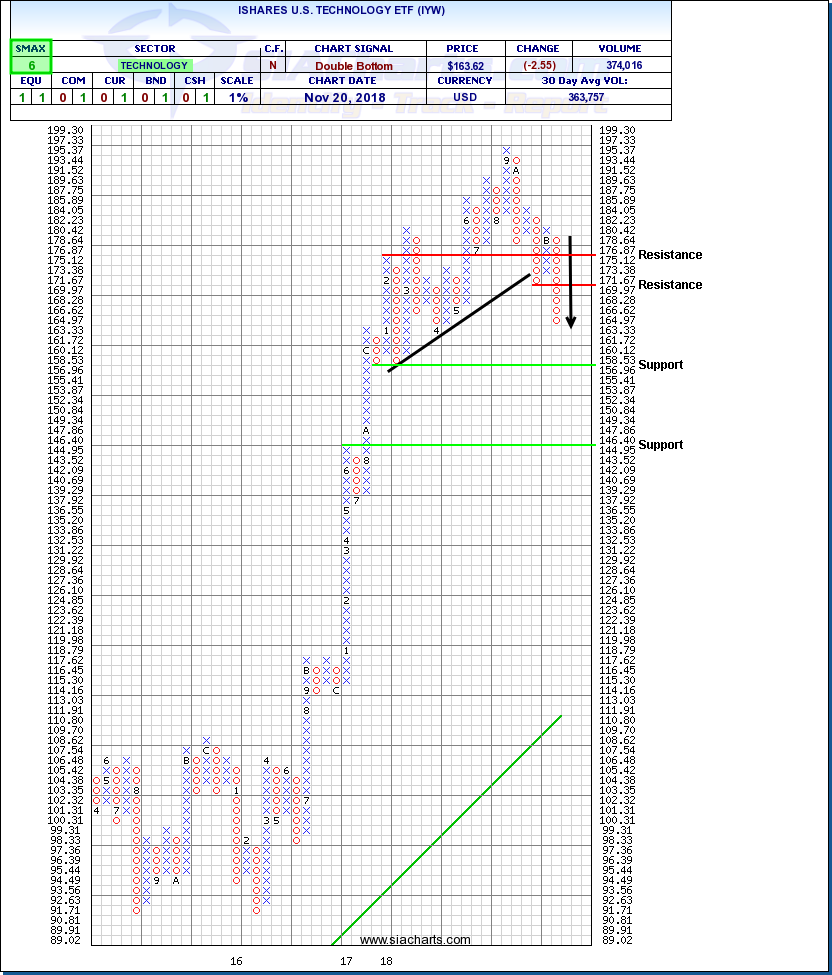
iShares US Technology ETF (IYW)
It looks like the rolling bear market which has been playing out through sectors and bourses around the world over the course of this year has finally caught up to the technology sector. Back in the late summer, when some European and Asia Pacific markets were down 10%-20%, IYW was hitting all-time highs just short of the $200 level. Resistance held at that big round number and for the last two months, IYW has been trending downward. This month, the ETF has dropped from near $180 under $165, completing a bearish Double Bottom and confirming that a previous uptrend has been snapped.
In some cases, it seems like the longer a selloff has been postponed, the steeper the drop when it finally arrived. Apple, for example, plunged over 20% from November 1st to the 20th, a very rapid bear market that could explain why losses in IYW have accelerated lately.
With a bullish SMAX of 6, IYW continues to exhibit positive performance relative to the asset classes, but the ETF remains vulnerable to darkening sentiment toward the technology sector. Next potential downside support levels appear near $157 then $145. Initial resistance on a rebound could appear at the recent breakdown point near $172.
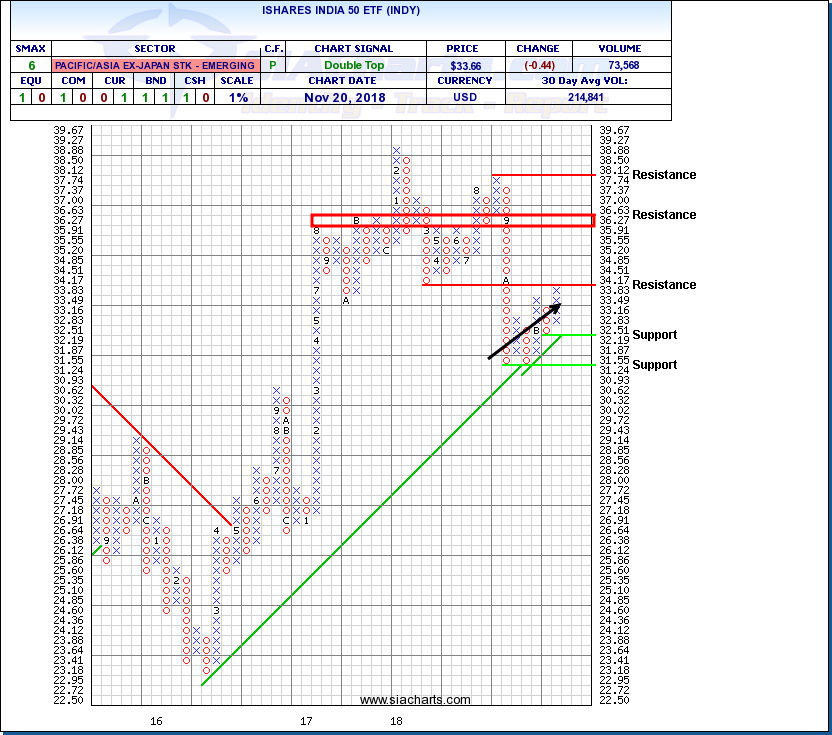
iShares India 50 ETF (INDY)
Most recently, the high-flying areas of the market (technology) are getting crushed this month which has attracted a lot of public attention. However, some of the areas that plunged previously, such as some emerging markets, have started to regain their footing and bottom out.
India, for example, peaked back in February and then again at a lower high in August. INDY sold off dramatically between August and October falling nearly 20% over that time. The selloff was finally contained by support at an uptrend line near $30.90.
Higher highs and lows in recent weeks for INDY indicate renewed accumulation in the Indian market. A recent breakout over $33.83 has completed a bullish Double Top. Currently INDY is bumping up against an old support level near $34.00. A breakout there would confirm the start of a new recovery trend with next potential resistance in the $35.00-$36.00 range.
As the markets which have been leading the downturn start to stabilize and turn back upward, it suggests that the later stage selloffs in markets like the US may also eventually run their course although volatility could remain higher in the near term.